| Issue |
A&A
Volume 683, March 2024
|
|
|---|---|---|
| Article Number | A21 | |
| Number of page(s) | 12 | |
| Section | Galactic structure, stellar clusters and populations | |
| DOI | https://doi.org/10.1051/0004-6361/202347811 | |
| Published online | 29 February 2024 | |
eRASSU J060839.5–704014: A double degenerate ultra-compact binary in the direction of the LMC⋆
1
Max-Planck-Institut für Extraterrestrische Physik, Gießenbachstraße 1, 85748 Garching, Germany
e-mail: cmaitra@mpe.mpg.de
2
Université de Strasbourg, CNRS, Observatoire Astronomique de Strasbourg, UMR 7550, 67000 Strasbourg, France
3
Department of Physics, National and Kapodistrian University of Athens, University Campus Zografos, 15783 Athens, Greece
4
Leibniz-Institut für Astrophysik Potsdam (AIP), An der Sternwarte 16, 14482 Potsdam, Germany
5
South African Astronomical Observatory, PO Box 9, Observatory Rd, Observatory 7935, South Africa
6
Department of Astronomy, University of Cape Town, Private Bag X3, Rondebosch 7701, South Africa
7
NSF’s National Optical/Infrared Research Laboratory (NOIRLab), 950 N. Cherry Ave, Tucson, AZ 85732, USA
8
Perimeter Institute for Theoretical Physics, 31 Caroline Street North, Waterloo, ON N2L 2Y5, Canada
Received:
26
August
2023
Accepted:
22
November
2023
Context. During four all-sky surveys (eRASS1–4), eROSITA, the soft X-ray instrument aboard Spektrum-Roentgen-Gamma (SRG) detected a new supersoft X-ray source, eRASSU J060839.5−704014, in the direction of the Large Magellanic Cloud (LMC).
Aims. We arranged follow-up observations in the X-ray and optical wavelengths and further searched in archival observations to reveal the nature of the object.
Methods. Using X-ray observations with XMM-Newton we investigated the temporal and spectral behaviour of the source.
Results. We discover pulsations at 374 s with a pulse profile consistent with 100% modulation. We identify two other periodicities in the eROSITA data, which we establish as aliases due to the sampling of the eROSITA light curve. We identify a multi-wavelength counterpart to the X-ray source in UVW1 and g, r, i, and z images obtained by the optical/UV monitor on XMM-Newton and the Dark Energy Camera at the Cerro Tololo Inter-American Observatory. The timing and spectral characteristics of the source are consistent with a double degenerate ultra-compact binary system in the foreground of the LMC. eRASSU J060839.5−704014 belongs to a rare class of AM CVns, which are important to study in the context of progenitors of SN Ia and for persistent gravitational wave detection.
Conclusions. We identify eRASSU J060839.5−704014 as a new double degenerate ultra-compact binary located in the foreground of the LMC.
Key words: white dwarfs / Magellanic Clouds / X-rays: binaries / X-rays: individuals: eRASSU J060839.5−704014
© The Authors 2024
 Open Access article, published by EDP Sciences, under the terms of the Creative Commons Attribution License (https://creativecommons.org/licenses/by/4.0), which permits unrestricted use, distribution, and reproduction in any medium, provided the original work is properly cited.
This article is published in open access under the Subscribe to Open model.
Open Access funding provided by Max Planck Society.
1. Introduction
Double degenerate ultra-compact binary systems comprise two compact objects (white dwarfs, neutron stars, or black holes) at the post-common envelope phase of binary evolution. Double degenerate interacting white dwarf systems (DDs from now) are particularly interesting from the cosmological perspective as possible progenitors of SNe Ia (Liu et al. 2018). In addition, these systems, which are expected to be in tight binary orbits, can merge due to the loss of orbital angular momentum and are expected to be strong emitters of gravitational waves (GWs) detectable by future space-based gravitational wave detectors like, for example, the Laser Interferometer Space Antenna (LISA; Li et al. 2020). For a comprehensive review of double degenerate systems including DDs, see (Postnov & Yungelson 2014, and references within).
DDs have been identified in X-rays as a sub-class of heterogenous objects classified as supersoft X-ray sources (SSSs), first identified with ROSAT (Trümper et al. 1991). SSSs are characterised by very soft X-ray spectra with kT ∼ 15−80 eV (e.g. Kahabka & van den Heuvel 1997) and a wide range of luminosities. The most luminous (∼1036 to ∼1038 erg s−1) can be explained by stable nuclear burning white dwarfs (WDs), which in most cases accrete H-rich matter from a companion star (van den Heuvel et al. 1992). Other objects in this class include WDs as central stars of planetary nebulae (PNe; Kahabka et al. 2008; Mereghetti et al. 2010), and magnetic cataclysmic variables (mCVs), including polars and soft intermediate polars (see e.g., Cropper 1990; Haberl & Motch 1995; Burwitz et al. 1996; Anzolin et al. 2008; Orio et al. 2022). A majority of these systems were discovered in the direction of the Magellanic Clouds, which are frequently observed by X-ray observatories. The low Galactic foreground absorption in their direction makes them ideal laboratories for the detection and investigation of SSSs (Maitra & Haberl 2022).
Three sources, RX J0806.3+1527 (HM Cnc, Beuermann et al. 1999), its twin RX J1914.4+2456 (V407 Vul, Haberl & Motch 1995), and 3XMM J051034.6−682640 Haberl et al. 2017, discovered as SSSs in ROSAT and XMM-Newton data, are considered classical examples of DDs with periodicities of 5.4 min, 9.5 min and 23.6 min, respectively. These periods were also found in the light of their optical companions (HM Cnc: Ramsay et al. 2002; Israel et al. 2002, V407 Vul: Ramsay et al. 2000, 3XMM J051034.6−682640: Ramsay et al. 2018).
The X-ray flux drops to zero between pulses, and no other periods are seen (Esposito et al. 2014; Cropper et al. 1998; Haberl et al. 2017).
Several models have been proposed to explain the X-ray emission from these systems. The two main accretion models in this regard include mass transfer from a Roche-lobe-filling WD to either a magnetic (polar-like) or a non-magnetic (Algol-like) accretor. In the polar-like model (Cropper et al. 1998), the magnetic field of the accreting WD inhibits the formation of an accretion disc and matter reaches the magnetic polar cap. In the Algol-like type, also known as a “direct impact” accretion model (Nelemans et al. 2001; Marsh & Steeghs 2002), a light companion is assumed so that a disc would not form, resulting in the stream directly hitting the surface of the accreting WD. However, models invoking accretion predict an orbital widening for the two degenerate WDs, in contrast to what is observed in RX J0806.3+1527 and RX J1914.4+2456, although solutions to circumvent this issue have been proposed (see Kaplan et al. 2012, and references therein). The main alternative to the accretor model is the “unipolar inductor” model (e.g. Dall’Osso et al. 2006; Colpi et al. 2009). This model involves a magnetic primary WD and a (non-magnetic) secondary that does not fill its Roche lobe. In this case, if the spin period of the primary and the orbital period are not synchronous, then the secondary crosses the primary’s magnetic field as it moves along the orbit. The resulting electromotive force drives an electric current between the two WDs (assuming the presence of ionised material between them), whose dissipation heats the polar caps on the primary. This method has however been highlighted as not being efficient enough to explain the observed X-ray flux (Lai 2012).
Nonetheless, the emission mechanism for the population of DDs remains an open question and more observable systems are required to fine-tune the models.
Here, we report on the discovery of a new SSS in the direction of the Large Magellanic Cloud (LMC), eRASSU J060839.5−704014, which we identify as a DD candidate in the foreground. In Sect. 2 we present the X-ray observations of the object, including eROSITA and XMM-Newton observations. Section 3 describes the temporal and spectral analysis of the X-ray data. Section 4 describes the identification of the optical counterpart provided from Dark Energy Camera (DECam) archival exposures and GROND observations, and Sect. 6 presents the discussion and our conclusions.
2. X-ray observations
2.1. eROSITA
eRASSU J060839.5−704014 was discovered as a bright new source by eROSITA (Predehl et al. 2021), the soft X-ray instrument on board the Spektrum-Roentgen-Gamma (SRG) mission (Sunyaev et al. 2021), which surveyed the X-ray sky between December 2019 and February 2022 in the energy range of 0.2−8 keV. The source was detected in all four all-sky surveys (eRASS1 to eRASS4) and was scanned a total of 375 times between 12:57 UTC on March 13 2020 (MJD 58921.53976) and 22:02 UTC on September 27 2021 (MJD 59484.918664). During this interval, it collected a total exposure of 5.2 ks (after taking into account vignetting and dead-time corrections); see Table 1. For the data analysis, we used the eROSITA Standard Analysis Software System (eSASS version eSASSusers_211214_0_3; Brunner et al. 2022). To extract source and background events corresponding to light curves and spectra, we used the eSASS task srctool (see e.g. Maitra et al. 2021; Haberl et al. 2022). For the source products, we selected all valid pixel patterns (PATTERN = 15) and used circular regions with radii of 50″ and 75″ around the position of the source and a nearby source-free region. For the light curves, we combined the data from all cameras (telescope modules (TMs) 1−7) and applied a cut in the fractional exposure of 0.15 (FRACEXP > 0.15). The fractional exposure corresponds to the product of the fractional collecting area and the fractional temporal coverage that overlaps with the time bin. We created a combined spectrum from the data of TMs 1−4 and 6, the five cameras with an on-chip optical blocking filter. TM5 and TM7 suffer from a light leak (Predehl et al. 2021) and no reliable energy calibration is available yet. We also performed barycentre corrections by converting the arrival time of the photons from the local satellite into the Solar System barycentric frame using the HEASOFT task barycen, the JPL-DE405 ephemeris table, and the target coordinates. We refer to Schwope et al. (2022) for details. Finer timing corrections such as clock drifts and frame time jitters would be considered in the next data processing version but do not affect the precision of a relatively slow periodic signal like that detected in eRASSU J060839.5−704014.
eROSITA and XMM-Newton observations of eRASSU J060839.5−704014.
2.2. XMM-Newton
To investigate the nature of eRASSU J060839.5−704014 in detail, we triggered one of our XMM-Newton anticipated target of opportunity observations (PI: Maitra) to follow up on new supersoft sources in the Magellanic system. XMM-Newton consists of the European Photon Imaging Camera (EPIC, 0.15−12 keV band), with two of the three XMM-Newton telescopes equipped with metal oxide semi-conductor (MOS) CCD arrays (Turner et al. 2001) and the third with a pn-CCD (Strüder et al. 2001). The observation was performed on January 22 2022 (observation ID 0882050401, start MJD = 59600.6412). We used the EPIC cameras with thin optical blocking filters, in full-frame readout mode. XMM-Newton/EPIC data were processed using the XMM-Newton data analysis software SAS, version 19.1.01. For the best X-ray source position, we used the one derived by the XMM-Newton pipeline of  and
and  with a 1σ statistical uncertainty of
  and a remaining systematic error of
  after astrometric correction. The mean EPIC-pn count rate in the soft band (0.2−1.0 keV, corrected for vignetting) was determined by the source detection algorithm to (0.21 ± 0.01) cts s−1. We extracted the events to produce images, the spectrum, and the light curve using the SAS task evselect. For the extraction of the source products, circular regions around the source position and a nearby source-free area were used as source and background regions (with radii of 40″ and 60″, respectively, see Fig. 1). Due to the higher sensitivity of the pn detector compared to the MOS detectors at low energies, we used only EPIC-pn data for spectral analysis. Single- and double-pixel events (PATTERN 0−4) were selected, excluding known bad CCD pixels and columns (FLAG 0). For the spectra, we removed times of increased flaring activity when the background was above a threshold of 8 counts ks−1 arcmin−2 (7.0−15.0 keV band).
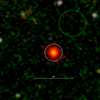 |
Fig. 1. Region around eRASSU J060839.5−704014 extracted from the full RGB mosaic of the EPIC LMC observations showing the source (white) and background extraction circles (green). |
The SAS tasks arfgen and rmfgen were used to generate the corresponding detector response files for the EPIC-pn spectrum.
We obtained a net exposure of 25.7 ks for EPIC-pn and EPIC-MOS, respectively, after we removed intervals of high background flaring activity, which occurred only at the end of the observation. Table 1 summarises the observation details.
3. X-ray data analysis
3.1. Temporal analysis
The eRASS surveys scanned the whole sky in great circles with a scanning period of 4 h, the length of an eRODay that intercepted at the ecliptic poles. Although a typical scan lasts for up to 40 s (separated by 4 h), when a source is located in the direction of the LMC, which is close to the South Ecliptic Pole, it is scanned many times during a visibility period of several weeks per eRASS. Each eROSITA survey (eRASSn) is repeated after six months, allowing a source to be monitored on timescales of years. We present here the eROSITA data of eRASSU J060839.5−704014 from the first four complete all-sky surveys (eRASS1, 2, 3, and 4). Figure 2 shows the 0.2−2 keV eROSITA light curve of eRASSU J060839.5−704014 as it was scanned during each eRASS. The source exhibited a stable count rate (see Table 1, after background subtraction, taking into account corrections for vignetting and losses due to the point spread function of the telescopes) in all four surveys. The light curves show a dipping behaviour alternating between “on” and “off” (zero-flux) states in each consecutive scan. An additional longer-term modulation is also apparent (see Fig. 2 right). In order to investigate the possible periodic signals in detail, we used a Lomb-Scargle (LS) periodogram analysis (Lomb 1976; Scargle 1982). Periodicities at two different timescales are clearly detected (Fig. 3); the alternating dipping feature corresponds to a main peak at 8.21 h and a secondary one at 7.77 h. A second periodicity is also detected at 6.7 days, corresponding to the longer-term modulation in the light curve.
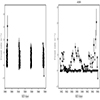 |
Fig. 2. eROSITA 0.2−2 keV light curves of eRASSU J060839.5−704014. The black points represent a single scan. The count rates of bins with fewer than ten counts are plotted as 1σ upper limits. The total light curve of eRASS1–4 is shown left, with a zoomed-in view covering eRASS1 on the right. |
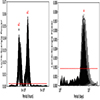 |
Fig. 3. Lomb-Scargle periodograms of the eRASS1–4 light curve showing the periodicities at 7.77 and 8.21 h (left) and at 6.7 days (right). The dashed red line marks the 99% confidence level. |
The background-subtracted 0.2−2.0 keV light curves of eRASSU J060839.5−704014 obtained from the three EPIC instruments do not exhibit any long-term variability on timescales of hours. However, a Lomb-Scargle periodogram reveals a very strong signal at 374 s as shown in Fig. 4.
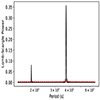 |
Fig. 4. Lomb-Scargle periodogram of eRASSU J060839.5−704014 obtained from the combined XMM-Newton data (0.2−1.0 keV). Pulsations are detected with of period of 374 s. The dashed red line marks the 99.73% confidence level obtained by the block-bootstrapping method. |
The best-determined period and the 1σ uncertainty are given by 374.03 ± 0.21 s.
To estimate the uncertainty on the periodic signal, we applied a block-bootstrapping method, similar to that described in Gotthelf et al. (1999) and Carpano et al. (2022), by generating a set of 10 000 light curves. The background-subtracted and combined XMM-Newton light curve obtained by combining the two modules and folding with the best-obtained period is shown in Fig. 5. The X-ray signal is characterised by a 100% modulation with a duty cycle of ∼50%.
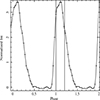 |
Fig. 5. Background-subtracted and combined XMM-Newton light curve folded with the best-fitted period showing the pulse profile of eRASSU J060839.5−704014 in the energy band of 0.2−1 keV. The pulse profile is normalised to the mean count rate of 0.21 cts s−1. The vertical lines show the interval taken as on-pulse for phase-resolved spectroscopy. |
The periodicity detected with XMM-Newton further indicates that the 8.2 h and 6.67 days are aliases due to sampling of the eROSITA light curve with the eROSITA scanning period of 4 h, which is almost exactly 38.5 times the pulse period of 374.03 s. Therefore, eROSITA detects alternating on-off states every other scan because of the pulse profile, which is ∼50% on-off. Also, 6.67 days corresponds very accurately to 40 eROSITA scans.
3.2. Period constraints from eROSITA survey data
As mentioned in the previous section, the on-off pattern observed in the eROSITA light curve is a result of the aliasing between the actual pulse period and the ∼4-h sampling of eROSITA. In order to investigate this, we constructed a so-called aliasing model based on the “pulse” profile observed by XMM-Newton and the eROSITA sampling and used it to reconstruct a fake eROSITA light curve. For simplicity we assumed each model point is based on a single point of the XMM-Newton profile, that is, we did not integrate for eROSITA exposure. This model can reconstruct the 6.7 d periodicity. However, the resulting period is quite sensitive to the actual pulse period, as a decrease of 0.1 s in the period can increase the aliasing period by a factor of two. This dependence can be used to constrain the periodicity of eRASSU J060839.5−704014 by fitting the alias model to the actual eROSITA light curve. We used a python implementation of the Goodman & Weare’s Affine Invariant Markov chain Monte Carlo (MCMC) Ensemble sampler (i.e. emcee). Our model has four free parameters, the reference phase, period, and amplitude (i.e. re-normalisation between XMM-Newton and eROSITA) of the periodic signal, while we also added a term of lnf to account for the systematic scatter and noise of our data not included in the statistical uncertainties of the measurements. We derived a period of 374.15029(3) s with the corner plot of the posterior distribution of the model parameters shown in Fig. 6. The comparison of the model and the data is shown in Fig. 7.
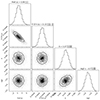 |
Fig. 6. Corner plot of the model fitted to the eROSITA data. Pref is the reference time compared to the time of the first eROSITA point of the data set, i.e. MJD 58921.70648. |
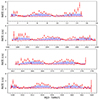 |
Fig. 7. Comparison of the eROSITA data (red points) with the predictions of the aliasing model (dashed blue line). For plotting purposes we have connected the model points, although this bears no physical meaning. |
To further investigate the uncertainties of this method we performed additional tests. We first repeated the fit in the individual eROSITA epochs and found a consistent period with an uncertainty of the order of 0.003 s. By repeating the procedure with and without barycentric corrections on the complete eROSITA data set we found a difference of 5 × 10⁻⁵ s and comparable uncertainties. Another potential question is the presence of a period derivative. Including a period derivative in the model, we found a slightly different period of 374.1506(2) s and a derivative of 1.3(5)×10−11 s s−1. The uncertainties correspond to 1σ intervals. We note that, although the error is quite small, the real uncertainty should be dominated by uncertainties related to the barycentric corrections (in the absence of an absolute timing reference for eROSITA and spacecraft clock drifts in the current CALDB version), and multi-modal solutions in the parameter space. When exploring the parameter (i.e. P, Ṗ) space more thoroughly, we found degenerate solutions with both positive and negative spin period derivatives. Since the problem has a multi-modal parameter space we also attempted an alternative strategy of phase-connecting the eROSITA and XMM-Newton data sets. A reasonably good phase connection can be obtained with a constant P of 374.1510(2) s, with an upper limit on Ṗ ≤ 3.9 × 10⁻¹² s s−1. While a solution with a positive period derivative as quoted above (i.e. 1.3(5)×10−11 s s−1) yields a similar result, obtaining a solution with a negative derivative affects the phase connection of the aliasing model in the eROSITA data, and thus seems less likely. Based on the above experiments, we can conclude a few things. First, the presence of a stable aliasing pattern in the eROSITA data excludes a significant period evolution. Moreover, the multiple tests in the eROSITA data have revealed that we can measure the period of eRASSU J060839.5−704014 more accurately than the original XMM-Newton measurement, and we can conclude that the period can be determined to 374.1503(5) s, considering all uncertainties.
3.3. Spectral analysis
In order to model the spectra from the EPIC-pn observation and the eRASS, we used a Bayesian methodology (see Buchner et al. 2014, BXA)2, which allowed us to robustly model the low signal-to-noise eRASS spectrum as well as to look for additional spectral components in the case of EPIC-pn. BXA connects the nested sampling (Skilling 2004) algorithm MultiNest (Feroz et al. 2009) with XSPEC. It explores the parameter space and can be used for parameter estimation (probability distributions of each model parameter and their degeneracies) and for model comparisons (computation of Bayesian evidence, Z).
We modelled the background spectrum (extracted from the corresponding background regions) and used the best-fit models with an area scaling factor to account for the background component in the spectrum from the source region. We use the automatic background-fitting method described in the appendix of Simmonds et al. (2018), which is implemented in BXA. In this method, the background spectrum is modelled phenomenologically as a function of detector channels after a log(1 + counts) transformation. Principal component analysis (PCA) is run on the unbinned background spectra. The first six principal components (PCs) are then linearly combined to fit the particular background spectrum of interest. Starting from the mean spectrum, PCs are iteratively added as long as the Akaike information criterion (AIC; Akaike 1974) of the fit is significantly improved. After finding the linear combination of PCs that describes the spectrum best, Gaussian lines are added to further model detector-related features. These added Gaussians can model features that might appear in some individual spectra and were missed by the PCA. The XMM-Newton and eROSITA background models could be sufficiently described by five PCs and two PCs, respectively. The addition of Gaussian components did not further improve the AIC. Finally, the best-fit background model spectrum was converted into an XSPEC table model with a scale parameter (the ratio between the BACKSCAL of the source and the background when fitting the source spectrum). A similar analysis was conducted in Liu et al. (2022).
The eROSITA spectra can be fitted with an absorbed black-body model. To account for the NH, first, we assumed that the source is located in the LMC and used two column densities along the line of sight. One accounts for the Galactic foreground with solar abundances according to Wilms et al. (2000) and was fixed at the value obtained from H I measurements (Dickey & Lockman 1990)3. The other (free in the fit), with metal abundances set to 0.5, reflects the absorption by the interstellar medium of the LMC (Rolleston et al. 2002) and local to the source. Second, if the source could be closer and located in the Milky Way, we used only one column density with the solar abundance, allowing it to be a free parameter in the spectral fit. Luminosities were corrected for absorption and calculated assuming a distance of 50 kpc in the case of the LMC and 1 kpc in the case of our Galaxy.
At first, eROSITA spectra from the different epochs (eRASS1/2/3/4) were modelled separately to investigate possible variation in spectral parameters during the different surveys. We however verified that the spectral parameters were consistent with each other and present the spectrum combined from all four eRASSs (eRASS:4) with data summed from the TMs with an on-chip filter (TM1, 2, 3, 4, and 6).
From the posterior distribution of each parameter, we measured the median and the 1σ percentile confidence interval around the median as shown in the corner plots in Fig. 8. The posterior distributions of the model parameters overlayed with the convolved spectrum are shown in Fig. 9.
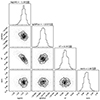 |
Fig. 8. Corner plot of the posterior distributions for the eRASS:4 spectral fit with a single NH model. NH is in units of 1022 atoms cm−2. |
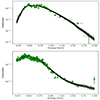 |
Fig. 9. Spectral fit of eRASSU J060839.5−704014 using the eROSITA spectrum from eRASS:4 (top) and EPIC-pn (bottom) together with the posterior distributions of model parameters. The spectrum for each eRASS was extracted by combining data from the TMs with an on-chip filter. See Table 2 for the model parameters. Darker and lighter bands enclose the 68% and 95% posterior uncertainties on the model at each energy. |
The spectral parameters are detailed in Table 2, where the log Z column (normalised to highest) shows the computed evidence.
Spectral fit results of eRASSU J060839.5−704014 from BXA.
In the case of the XMM-Newton/EPIC spectrum, we used the same model of a black-body emission attenuated by photo-electric absorption as in the case of eROSITA. However, we additionally tested for the presence of a bremsstrahlung model (bremsstrahlung is generally seen in the X-ray spectra of mCVs, see e.g. Mukai 2017). We fixed the temperature at 10 keV and assumed that black-body and bremsstrahlung components are attenuated by the same NH. For this, we computed the difference in the log Z that corresponds to a Bayes factor (BF), which can be used to discriminate between the models. A commonly used way to interpret the BF values is the Jeffrey scale, which strengthens the choice of one model over the other approximately every time that the logarithm of the BF increases by one in natural logarithmic units (Robert et al. 2009); see also Buchner et al. (2014). Uniform model priors are assumed in this case, with a cut of log10(30) considered to be “decisive”.
The addition of the bremsstrahlung component showed a significant improvement in this regard with a log Z of −62.7. The contribution of the bremsstrahlung component corresponds to an LX ≃ 4 × 1032 erg s−1 in the 2−8 keV range. The median and the 1σ percentile confidence intervals for each parameter are shown in the corner-plots in Fig. 10. The posterior distributions of the model parameters overplotted with the convolved spectrum are shown in Fig. 9, and the spectral parameters are summarised in Table 2.
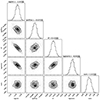 |
Fig. 10. Corner plot of the posterior distributions for the XMM-Newton EPIC-pn spectral fit with a single NH and after adding the bremsstrahlung component. NH is in units of 1022 atoms cm−2. |
We also extracted the spectra at the “on” and “off” pulse phases, as shown in Fig. 5. The bremsstrahlung component is detected more significantly in the “off” pulse spectrum, as seen in Table 2. The rest of the parameters are consistent within their errors.
4. UV, optical, and near-infrared data
Using the VizieR catalogue access tool4, a star with NUV ∼ 22 mag was found marginally consistent within the 1σ error circle of the XMM-Newton position of eRASSU J060839.5−704014 in the GALEX DR5 (Bianchi et al. 2011) catalogue (see Table 3).
Optical photometry of the optical counterpart near eRASSU J060839.5−704014.
To obtain deeper images of the area around eRASSU J060839.5−704014, we performed observations with the Gamma-ray Burst Optical Near-IR Detector (GROND, Greiner et al. 2008) at the MPG 2.2 m telescope in La Silla, Chile on August 4 2016. For g′, r′, i′, and z′ we obtained a total of 21.2 ks in each filter, while for J, H, and K 19.4 ks per filter were accumulated. We analysed the data with the standard tools and methods described in Krühler et al. (2008). Photometric calibration for the g′, r′, i′, and z′ filter bands was obtained from the observation of an SDSS (Sloan Digital Sky Survey) standard star field. The J, H, and K photometry was calibrated using selected 2MASS stars (Skrutskie et al. 2006). However, we note that the GROND photometry was contaminated by a nearby bright object, and therefore we did not use it to analyse the spectral energy distribution (SED) of the object.
The optical counterpart was also identified in archival data from DECam (Flaugher et al. 2015), a wide-field CCD camera on the Blanco 4-m telescope at the Cerro Tololo Inter-American Observatory. 24 exposures in g, r, i, and z filters from three programmes were used (including the DECam eROSITA Survey, DeROSITAS, an optical companion survey to the eROSITA survey). The exposures were instrumentally calibrated by the DECam Community Pipeline (Valdes 2021) and catalogued for the Legacy Surveys’ (Dey et al. 2019) data release DR10. The analysis uses the Tractor (Lang et al. 2016) forward modelling method. The method fits models to the observations, taking the point spread functions from the exposures into account. The Tractor fitting agrees with a very compact galaxy or a point source; that is to say, the data are consistent with either a slightly extended source or a star. The position of the optical counterpart corresponds to  and
and  with a 1σ statistical uncertainty of
  and a remaining systematic error of a similar order after astrometric correction5.
The total exposures accumulated in the [g, r, i, z] filters are 3.1 ks, 2.7 ks, 1.4 ks, and 0.6 ks, respectively. The measured AB magnitudes, an absolute spectral flux density photometric system, are [22.15, 21.82, 21.76, and 21.64] in [g, r, i, and z], respectively, and given in Table 3. The photometric calibration is tied to Pan-STARS DR1 (Chambers et al. 2016) through an uber-cal self-calibration method (Schlafly et al. 2012). The images centred on the position obtained for the counterpart of eRASSU J060839.5−704014 are shown in Fig. 11.
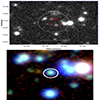 |
Fig. 11. Optical images around eRASSU J060839.5−704014. Top: GROND g′ band image. The large white circle (radius 5″) marks the eROSITA error circle and the red circle indicates the 1σ position uncertainty obtained from the XMM-Newton/EPIC X-ray images. The small white circle marks the position of the proposed optical counterpart. The three nearest Gaia objects are marked, demonstrating the good astrometric quality of the XMM-Newton data. Bottom: zoomed-in archival DECam image centred on the optical counterpart from the top figure. The image is produced from a number of exposures, which were co-added to create the individual filter images for the presented colour composite. The data are taken from the Legacy Survey release 10 (DR10). |
Figure 12 shows the Galactic foreground-corrected SED6 using the DECam g, r, i, and z-band magnitudes converted to flux densities. GALEX (NUV, FUV) and GROND photometry were not included due to contamination from nearby bright objects. The SED is consistent with a power law of slope of −1. Notably, it substantially diverges from the observations of a hot black body associated with the surface of the primary WD for RX J0806.3+1527 (Esposito et al. 2014). This suggests that the SED of eRASSU J060839.5−704014 is either dominated by a different emission region or arises from multiple components. A simple black-body fit is insufficient to describe the data in this case.
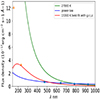 |
Fig. 12. Optical IR (DECam) flux density of eRASSU J060839.5−704014 (blue dots) with the best-fit black-body spectrum in red and a power law overplotted in blue. The UV fluxes from GALEX are plotted as upper limits (in orange) as they were contaminated by a nearby bright object and were not used for the fit. Also overplotted is a black-body spectrum with a temperature of 27 000 K in green, as obtained for the case of the DD system RX J0806.3+1527 (Esposito et al. 2014). |
We also examined our XMM-Newton optical/UV monitor (OM) data but could not find a significant source at the optical position of the counterpart. The faintest star that was detected in the OM data has a magnitude of ∼18.9 mag. Thus, the non-detection is consistent with the above-derived magnitudes from GROND and archival data.
5. Long-term variability
In order to investigate the long-term trend of eRASSU J060839.5−704014, we looked in the HILIGT upper limit server7. The position of eRASSU J060839.5−704014 was previously covered by the Einstein Observatory, ROSAT and 18 XMM-Newton slews. Data for all XMM-Newton slews were downloaded from the XMM-Newton Science Archive8 and reviewed manually. Significant counts at the source position of eRASSU J060839.5−704014 could only be determined for three slews: one belongs to our XMM-Newton pointed observation; the other two are listed in the full and clean XMM-Newton Slew Survey XMMSL2 Source Catalogue9. Fluxes for all previous observations were taken from the XMM-Newton upper limit server. They were calculated by converting the count rates, assuming a black body with a temperature of 100 eV and an NH = 1 × 1021 cm−2. Upper limits are given with a 99.7% confidence level. The errors are 1σ errors from the upper limit server. Fluxes and errors for XMM-Newton pointed and eROSITA data correspond to those determined from the spectral fits (see Table 2). The fluxes from the ROSAT, XMM-Newton pointed and eROSITA observations agree within their error margins, while for XMM-Newton slew data marginally higher fluxes were determined. However, the short exposures of the slew observations (5−16 s) likely reflect the short-term variability of the object, as the flux depends strongly on the pulse phase covered by the slew observations. We checked that detections during the slews preferentially occur near pulse maximum (the best-obtained flux at the pulse maximum is a factor of ∼3 higher than the phase-averaged flux, see Table 2) while slews during phases of low flux lead to non-detections, as many derived upper limits suggest. We also verified this by checking the phase of the slew closest to our XMM-Newton observation by using the best-fit periodicity value and confirmed that the times coincide close with the pulse maxima. Excluding the XMM-Newton slew data, the ratios of the maximum flux from the pointed ROSAT and XMM-Newton observations and the eROSITA data are 1.25 ± 1.1 and 0.9 ± 0.6, respectively, consistent with constant flux (Fig. 13).
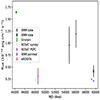 |
Fig. 13. Long-term X-ray light curve of eRASSU J060839.5−704014 for the 0.2−2 keV band. The mean value of all observations from eRASS1–4 is marked in red and our XMM-Newton pointed observation in blue. The two sources from the clean XMMSL2 catalogue are marked with a black “+”. The black “×” marks the slew observation that belongs to our XMM-Newton pointed observation. A black-body model with a temperature of 100 eV was used for flux conversion for the data from the upper limit server, i.e. for Einstein, ROSAT and XMM-Newton slew data. The 1σ errors are given for ROSAT and XMM-Newton slew data, and the Einstein upper limit is given with a 99.7% confidence level. Errors for XMM-Newton pointed and eROSITA data have 90% confidence intervals. |
The two sources that are both listed in the clean and full catalogue have distances to eRASSU J060839.5−704014 of 4.3″ and 6″ and positional errors of 4.3″ and 3.2″, respectively. They were recorded with 6.1 ± 2.5 and 17.9 ± 4.4 counts in the 0.2−2 keV band. Both are also detected in the 0.2−12 keV band with about the same number of counts, but not in the 2−12 keV band. Therefore, they must be soft sources and could be counterparts of eRASSU J060839.5−704014. However, we cannot fully exclude that the source whose positional error is half its distance to eRASSU J060839.5−704014 is a different object.
6. Discussion
eRASSU J060839.5−704014 is a new SSS in the direction of the LMC, discovered through eROSITA observations. We report an in-depth X-ray and optical study of the source using XMM-Newton, eROSITA, GROND, and DECam observations. We demonstrate that the properties of the source strongly indicate a double degenerate ultra-compact binary system. A periodicity of 374 s is discovered in the XMM-Newton and eROSITA data, which we attribute as the orbital period of the system of 6.2 min. The system exhibits characteristics similar to the two classical DD systems (see below), RX J0806.3+1527 (HM Cnc, Beuermann et al. 1999) and its twin RX J1914.4+2456 (V407 Vul, Haberl & Motch 1995) and the more recently discovered 3XMM J051034.6−682640 in the foreground of the LMC (Haberl et al. 2017).
The X-ray spectrum of eRASSU J060839.5−704014 can be described with absorbed black-body radiation. The derived temperature of kT ∼ 110 eV is at the slightly higher end but consistent with soft emission seen from SSSs (typical kT ∼ 40−90 eV, Haberl & Motch 1995; Burwitz et al. 1996). The derived NH is lower than the total Galactic value in the source direction (see Table 2), suggesting that eRASSU J060839.5−704014 is an SSS detected in the foreground of the LMC. A high density of known SSS in the direction of the Magellanic Clouds can likely be explained by the relatively low Galactic column density and the large number of existing X-ray observations sensitive to low energies (Maitra & Haberl 2022), which has an especially full coverage now with SRG/eROSITA.
The X-ray luminosity of the object is too low for it to be classified as a nuclear burning white dwarf (van den Heuvel et al. 1992). The presence of a periodicity of 374 s, the measured X-ray luminosity, and the detection of an additional hard bremsstrahlung spectral component in the XMM-Newton data (Table 2) could indicate a cataclysmic variable (CV) nature of the object, in particular an intermediate polar (IP). In IPs, the white dwarf orbits a late-type dwarf. The radiation originates as the accreted plasma couples to the field lines and forms a shock wave close to the WD magnetic poles. The X-ray emission originates from the heated polar caps emitting soft X-rays and the shocked plasma emitting thermal bremsstrahlung. A periodic signal of 374 s indicates the spin period of the WD in this case, and is consistent with values found in the literature (e.g. Patterson et al. 2020. However, there are several arguments to disfavour an IP nature of eRASSU J060839.5−704014. Firstly, CVs and IPs have bright optical counterparts and display log(fx/fopt)≲1.5 (Ritter & Kolb 2003; Mukai 2017). Fainter optical counterparts are usually detected in the case of DD ultra-compact binaries, (see Table 4 to compare the observed log(fX/fopt) values).
Properties of DD ultra-compact binaries.
Secondly, the X-ray flux of eRASSU J060839.5−704014 drops to zero between pulses, with a duty cycle of ∼50%. This would require an extreme geometric configuration for the IP with an inclination approaching 90° and in addition a very high NH at the off-cycle phases to absorb the flux completely.
Instead, if eRASSU J060839.5−704014 is a “polar”, in which the strong magnetic field of the white dwarf locks its spin to the orbit of its companion star, the 374 s (6.2 min) periodicity corresponds to the orbital period of the binary system. The above implies that eRASSU J060839.5−704014 has one of the shortest periods known for any binary system, only after the 5.4 min orbital period of HM Cnc. Such a small value implies that the donor is a degenerate star, making eRASSU J060839.5−704014 a probable member of the AM CVn stars that host double degenerate systems. It is most likely that eRASSU J060839.5−704014 belongs to this rare class of AM CVns when in the “direct impact” accretion scenario they pass through a short-living ultra-compact phase (DD) when binary periods close to 2−3 min are possible (Nelemans et al. 2001). Alternatively, in the “uni-polar” inductor model, this phase could last longer (up to 105 yr; Dall’Osso et al. 2007), depending on the asynchronisation between the spin and the orbital period of the system. Moreover, the detection of a 100% modulated pulsed flux and the absence of flux for 50% of the cycle further testifies in favour of its nature as an ultra-compact DD. The 100% modulation of the periodic signal can be explained by self–occultation of the stream impact point on the surface of the accreting white dwarf. The long term variation of the mean LX as demonstrated in Sect. 5 is also consistent with a DD’s nature (Israel et al. 2002; Dolence et al. 2008, and references therein).
Currently, there are only three other X-ray sources that fall into the category of a DD: namely, HM Cnc, V407 Vul, and 3XMM J051034.6−682640. Due to the compact orbit of the systems, accretion discs are not formed (as the minimum distance from the centre of the donor is smaller than the size of the accretor). A direct impact phase occurs instead, which lasts for a few million years (see Solheim 2010, for a review). The recent models involving direct impact accretion all require eRASSU J060839.5−704014 to have a luminosity greater than 1033 erg s−1, more likely of the order of 1034 erg s−1 (see e.g. Fig. 4 of Kaplan et al. 2012, and references therein). This requires the system to be at a distance ≳5 kpc. The LX for eRASSU J060839.5−704014 corresponds to ∼6 × 1031 erg s−1–1.5 × 1033 erg s−1 (d = 1 − 5 kpc, see also Table 2). This distance range is consistent with the population of old stars detected in the Milky Way’s stellar halo (Bell et al. 2008).
The alternative model to explain the emission from DD is the “unipolar inductor” (UI) model (e.g. Dall’Osso et al. 2006; Colpi et al. 2009) where the system is powered by electric currents (generated between a magnetic primary WD and a non-magnetic secondary that does not fill its Roche lobe). The maximum possible luminosity of eRASSU J060839.5−704014 in the case of the UI model is given by Lai (2012) as
where ζϕ depends on the degree of bending of the flux tube (ζϕ = 1 for a maximally bent tube), ΔΩ is the difference between the orbital frequency (Ω) and the primary spin frequency, μ is the magnetic moment of the primary, R is the secondary radius, Mtot the total mass of the system, and QX stands for a quantity, Q, in units of 10X. The estimate LX of eRASSU J060839.5−704014 is consistent with the expectations of the UI model for a distance between 1−2 kpc, and can explain the X-ray emission from the object.
Further observational evidence like deep optical observations to detect the orbital period and determine its phase with respect to X-rays are required to distinguish between the direct impact and UI models; for example, a varying phase offset detected between the optical and X-ray modulation can be naturally explained by the direct impact model (see discussion in Esposito et al. 2014). Determination of the orbital period evolution and a robust estimate of the period derivative is also crucial to constrain the models for DD (Marsh et al. 2004, and references). Another key to understanding the physical nature of DD is the possible detection of a hard bremsstrahlung component in the spectrum, especially in the off-pulse phase (see Fig. 5 and Table 2), which is one of the first such detections for this class of objects. The detection of a hard X-ray component could pave the way to further refining the direct impact shock regions, white dwarf masses in the system, and the specific accretion rates (Dolence et al. 2008).
Table 4 summarises the X-ray and optical properties of eRASSU J060839.5−704014 as compared to the three classical DDs HM Cnc, V407 Vul, and 3XMM J051034.6−682640. Although their distances are not well known, it seems that V407 Vul is significantly more luminous in X-rays than the other three objects. The bolometric luminosity is however uncertain, given the high NH in V407 Vul. The X-ray spectra of all three systems can be described by an absorbed black-body model; however, the measured black-body temperature and the detection of a hard tail in eRASSU J060839.5−704014 indicates that it is the hottest object of the three. It is also noteworthy that the pulse profiles of eRASSU J060839.5−704014 closely resemble those of HM Cnc and V407 Vul, rising steeply to the maximum, declining by half over the width of the pulse, and then dropping steeply again to zero. In the case of 3XMM J051034.6−682640, on the other hand, which has a slightly longer orbital period of 23.6 min, the profile is reversed, with a fast decay and a slower rise. Modelling the morphology of the pulse profiles can provide clues about the location of the emission region, and the size and extent of the X-ray emitting hotspot (see discussions in Ramsay et al. 2018).
Finally, the identification of eRASSU J060839.5−704014 as a DD ultra-compact binary provides valuable information on the rapidly growing class of this rare evolutionary phase in AM CVns. Understanding the evolution of AM CVns is also important as a fraction of them may create thermonuclear supernovae on timescales of ∼108 yr, either as Ia or Ia (Kilic et al. 2014; Liu et al. 2018). Furthermore, as systems with the shortest orbital periods ever recorded, DD ultra-compact binaries represent one of the most promising targets for persistent gravitational wave detection (Nelemans et al. 2001) and will be used in the verification phase of space-based gravitational wave observatories such as LISA (Korol et al. 2017; Li et al. 2020).
Science Analysis Software (SAS): https://www.cosmos.esa.int/web/xmm-newton/sas
Extracted using NASA’s HEASARC web interface https://heasarc.gsfc.nasa.gov/cgi-bin/Tools/w3nh/w3nh.pl
Acknowledgments
We thank the referee for useful comments and suggestions. This work is based on data from eROSITA, the soft X-ray instrument aboard SRG, a joint Russian-German science mission supported by the Russian Space Agency (Roskosmos), in the interests of the Russian Academy of Sciences represented by its Space Research Institute (IKI), and the Deutsches Zentrum für Luft- und Raumfahrt (DLR). The SRG spacecraft was built by Lavochkin Association (NPOL) and its subcontractors, and is operated by NPOL with support from the Max Planck Institute for Extraterrestrial Physics (MPE). The development and construction of the eROSITA X-ray instrument was led by MPE, with contributions from the Dr. Karl Remeis Observatory Bamberg & ECAP (FAU Erlangen-Nürnberg), the University of Hamburg Observatory, the Leibniz Institute for Astrophysics Potsdam (AIP), and the Institute for Astronomy and Astrophysics of the University of Tübingen, with the support of DLR and the Max Planck Society. The Argelander Institute for Astronomy of the University of Bonn and the Ludwig Maximilians Universität Munich also participated in the science preparation for eROSITA. The eROSITA data shown here were processed using the eSASS software system developed by the German eROSITA consortium. This work used observations obtained with XMM-Newton, an ESA science mission with instruments and contributions directly funded by ESA Member States and NASA. The XMM-Newton project is supported by the DLR and the Max Planck Society. This research has made use of data obtained from XMMSL2, the Second XMM-Newton Slew Survey Catalogue, produced by members of the XMM SOC, the EPIC consortium, and using work carried out in the context of the EXTraS project (“Exploring the X-ray Transient and variable Sky”, funded from the EU’s Seventh Framework Programme under grant agreement no. 607452). Work on NICER science at NRL is funded by NASA and the Office of Naval Research. Part of the funding for GROND (both hardware as well as personnel) was generously granted from the Leibniz-Prize to Prof. G. Hasinger (DFG grant HA 1850/28-1). G.V. acknowledges support by H.F.R.I. through the project ASTRAPE (Project ID 7802). This research has made use of the VizieR catalogue access tool, CDS, Strasbourg, France (DOI: https://doi.org/10.26093/cds/vizier). The original description of the VizieR service was published in Ochsenbein et al. (2000).
References
- Akaike, H. 1974, IEEE Trans. Autom. Control, 19, 716 [Google Scholar]
- Anzolin, G., de Martino, D., Bonnet-Bidaud, J.-M., et al. 2008, A&A, 489, 1243 [NASA ADS] [CrossRef] [EDP Sciences] [Google Scholar]
- Bailer-Jones, C. A. L., Rybizki, J., Fouesneau, M., Demleitner, M., & Andrae, R. 2021, AJ, 161, 147 [Google Scholar]
- Barros, S. C. C., Marsh, T. R., Dhillon, V. S., et al. 2007, MNRAS, 374, 1334 [NASA ADS] [CrossRef] [Google Scholar]
- Bell, E. F., Zucker, D. B., Belokurov, V., et al. 2008, ApJ, 680, 295 [Google Scholar]
- Beuermann, K., Thomas, H. C., Reinsch, K., et al. 1999, A&A, 347, 47 [NASA ADS] [Google Scholar]
- Bianchi, L., Herald, J., Efremova, B., et al. 2011, Ap&SS, 335, 161 [Google Scholar]
- Brunner, H., Liu, T., Lamer, G., et al. 2022, A&A, 661, A1 [NASA ADS] [CrossRef] [EDP Sciences] [Google Scholar]
- Buchner, J., Georgakakis, A., Nandra, K., et al. 2014, A&A, 564, A125 [NASA ADS] [CrossRef] [EDP Sciences] [Google Scholar]
- Burwitz, V., Reinsch, K., Beuermann, K., & Thomas, H.-C. 1996, A&A, 310, L25 [NASA ADS] [Google Scholar]
- Carpano, S., Haberl, F., Maitra, C., et al. 2022, A&A, 661, A20 [NASA ADS] [CrossRef] [EDP Sciences] [Google Scholar]
- Chambers, K. C., Magnier, E. A., Metcalfe, N., et al. 2016, arXiv e-prints [arXiv:1612.05560] [Google Scholar]
- Colpi, M., Casella, P., Gorini, V., Moschella, U., & Possenti, A. 2009, Astrophys. Space Sci. Lib., 359, 305 [NASA ADS] [CrossRef] [Google Scholar]
- Cropper, M. 1990, Space Sci. Rev., 54, 195 [CrossRef] [Google Scholar]
- Cropper, M., Harrop-Allin, M. K., Mason, K. O., et al. 1998, MNRAS, 293, L57 [NASA ADS] [CrossRef] [Google Scholar]
- Dall’Osso, S., Israel, G. L., & Stella, L. 2006, A&A, 447, 785 [CrossRef] [EDP Sciences] [Google Scholar]
- Dall’Osso, S., Israel, G. L., & Stella, L. 2007, A&A, 464, 417 [CrossRef] [EDP Sciences] [Google Scholar]
- Dey, A., Schlegel, D. J., Lang, D., et al. 2019, AJ, 157, 168 [Google Scholar]
- Dickey, J. M., & Lockman, F. J. 1990, ARA&A, 28, 215 [Google Scholar]
- Dolence, J., Wood, M. A., & Silver, I. 2008, ApJ, 683, 375 [NASA ADS] [CrossRef] [Google Scholar]
- Esposito, P., Israel, G. L., Dall’Osso, S., & Covino, S. 2014, A&A, 561, A117 [NASA ADS] [CrossRef] [EDP Sciences] [Google Scholar]
- Feroz, F., Hobson, M. P., & Bridges, M. 2009, MNRAS, 398, 1601 [NASA ADS] [CrossRef] [Google Scholar]
- Flaugher, B., Diehl, H. T., Honscheid, K., et al. 2015, AJ, 150, 150 [Google Scholar]
- Gotthelf, E. V., Vasisht, G., & Dotani, T. 1999, ApJ, 522, L49 [NASA ADS] [CrossRef] [Google Scholar]
- Greiner, J., Bornemann, W., Clemens, C., et al. 2008, PASP, 120, 405 [Google Scholar]
- Haberl, F., & Motch, C. 1995, A&A, 297, L37 [NASA ADS] [Google Scholar]
- Haberl, F., Israel, G. L., Rodriguez Castillo, G. A., et al. 2017, A&A, 598, A69 [NASA ADS] [CrossRef] [EDP Sciences] [Google Scholar]
- Haberl, F., Maitra, C., Carpano, S., et al. 2022, A&A, 661, A25 [NASA ADS] [CrossRef] [EDP Sciences] [Google Scholar]
- Israel, G. L., Hummel, W., Covino, S., et al. 2002, A&A, 386, L13 [NASA ADS] [CrossRef] [EDP Sciences] [Google Scholar]
- Israel, G. L., Covino, S., Stella, L., et al. 2003, ApJ, 598, 492 [NASA ADS] [CrossRef] [Google Scholar]
- Kahabka, P., & van den Heuvel, E. P. J. 1997, ARA&A, 35, 69 [NASA ADS] [CrossRef] [Google Scholar]
- Kahabka, P., Haberl, F., Pakull, M., et al. 2008, A&A, 482, 237 [NASA ADS] [CrossRef] [EDP Sciences] [Google Scholar]
- Kaplan, D. L., Bildsten, L., & Steinfadt, J. D. R. 2012, ApJ, 758, 64 [NASA ADS] [CrossRef] [Google Scholar]
- Kilic, M., Hermes, J. J., Gianninas, A., et al. 2014, MNRAS, 438, L26 [NASA ADS] [CrossRef] [Google Scholar]
- Korol, V., Rossi, E. M., Groot, P. J., et al. 2017, MNRAS, 470, 1894 [NASA ADS] [CrossRef] [Google Scholar]
- Krühler, T., Küpcü Yoldaş, A., Greiner, J., et al. 2008, ApJ, 685, 376 [Google Scholar]
- Lai, D. 2012, ApJ, 757, L3 [NASA ADS] [CrossRef] [Google Scholar]
- Lang, D., Hogg, D. W., & Mykytyn, D. 2016, Astrophysics Source Code Library [record ascl:1604.008] [Google Scholar]
- Li, Z., Chen, X., Chen, H.-L., et al. 2020, ApJ, 893, 2 [NASA ADS] [CrossRef] [Google Scholar]
- Liu, D., Wang, B., & Han, Z. 2018, MNRAS, 473, 5352 [Google Scholar]
- Liu, T., Buchner, J., Nandra, K., et al. 2022, A&A, 661, A5 [NASA ADS] [CrossRef] [EDP Sciences] [Google Scholar]
- Lomb, N. R. 1976, Ap&SS, 39, 447 [Google Scholar]
- Maitra, C., & Haberl, F. 2022, A&A, 657, A26 [NASA ADS] [CrossRef] [EDP Sciences] [Google Scholar]
- Maitra, C., Haberl, F., Vasilopoulos, G., et al. 2021, A&A, 647, A8 [NASA ADS] [CrossRef] [EDP Sciences] [Google Scholar]
- Marsh, T. R., & Steeghs, D. 2002, MNRAS, 331, L7 [NASA ADS] [CrossRef] [Google Scholar]
- Marsh, T. R., Nelemans, G., & Steeghs, D. 2004, MNRAS, 350, 113 [NASA ADS] [CrossRef] [Google Scholar]
- Mereghetti, S., Krachmalnicoff, N., La Palombara, N., et al. 2010, A&A, 519, A42 [NASA ADS] [CrossRef] [EDP Sciences] [Google Scholar]
- Mukai, K. 2017, PASP, 129, 062001 [Google Scholar]
- Nelemans, G., Portegies Zwart, S. F., Verbunt, F., & Yungelson, L. R. 2001, A&A, 368, 939 [NASA ADS] [CrossRef] [EDP Sciences] [Google Scholar]
- Ochsenbein, F., Bauer, P., & Marcout, J. 2000, A&AS, 143, 23 [NASA ADS] [CrossRef] [EDP Sciences] [Google Scholar]
- Orio, M., Gendreau, K., Giese, M., et al. 2022, ApJ, 932, 45 [NASA ADS] [CrossRef] [Google Scholar]
- Patterson, J., de Miguel, E., Kemp, J., et al. 2020, ApJ, 897, 70 [NASA ADS] [CrossRef] [Google Scholar]
- Pietrzyński, G., Graczyk, D., Gieren, W., et al. 2013, Nature, 495, 76 [Google Scholar]
- Postnov, K. A., & Yungelson, L. R. 2014, Liv. Rev. Relat., 17, 3 [NASA ADS] [CrossRef] [Google Scholar]
- Predehl, P., Andritschke, R., Arefiev, V., et al. 2021, A&A, 647, A1 [EDP Sciences] [Google Scholar]
- Ramsay, G. 2008, MNRAS, 384, 687 [NASA ADS] [CrossRef] [Google Scholar]
- Ramsay, G., Cropper, M., Wu, K., Mason, K. O., & Hakala, P. 2000, MNRAS, 311, 75 [NASA ADS] [CrossRef] [Google Scholar]
- Ramsay, G., Hakala, P., & Cropper, M. 2002, MNRAS, 332, L7 [NASA ADS] [CrossRef] [Google Scholar]
- Ramsay, G., Marsh, T. R., Kupfer, T., et al. 2018, A&A, 617, A88 [NASA ADS] [CrossRef] [EDP Sciences] [Google Scholar]
- Ritter, H., & Kolb, U. 2003, A&A, 404, 301 [NASA ADS] [CrossRef] [EDP Sciences] [Google Scholar]
- Robert, C. P., Chopin, N., & Rousseau, J. 2009, Stat. Sci., 24, 141 [Google Scholar]
- Rolleston, W. R. J., Trundle, C., & Dufton, P. L. 2002, A&A, 396, 53 [NASA ADS] [CrossRef] [EDP Sciences] [Google Scholar]
- Scargle, J. D. 1982, ApJ, 263, 835 [Google Scholar]
- Schlafly, E. F., Finkbeiner, D. P., Jurić, M., et al. 2012, ApJ, 756, 158 [NASA ADS] [CrossRef] [Google Scholar]
- Schlegel, E. M. 2005, A&A, 433, 635 [NASA ADS] [CrossRef] [EDP Sciences] [Google Scholar]
- Schwope, A., Pires, A. M., Kurpas, J., et al. 2022, A&A, 661, A41 [NASA ADS] [CrossRef] [EDP Sciences] [Google Scholar]
- Simmonds, C., Buchner, J., Salvato, M., Hsu, L. T., & Bauer, F. E. 2018, A&A, 618, A66 [NASA ADS] [CrossRef] [EDP Sciences] [Google Scholar]
- Skilling, J. 2004, in Bayesian Inference and Maximum Entropy Methods in Science and Engineering: 24th International Workshop on Bayesian Inference and Maximum Entropy Methods in Science and Engineering, eds. R. Fischer, R. Preuss, & U. V. Toussaint, AIP Conf. Ser., 735, 395 [NASA ADS] [CrossRef] [Google Scholar]
- Skrutskie, M. F., Cutri, R. M., Stiening, R., et al. 2006, AJ, 131, 1163 [NASA ADS] [CrossRef] [Google Scholar]
- Solheim, J. E. 2010, PASP, 122, 1133 [NASA ADS] [CrossRef] [Google Scholar]
- Strüder, L., Briel, U., Dennerl, K., et al. 2001, A&A, 365, L18 [Google Scholar]
- Sunyaev, R., Arefiev, V., Babyshkin, V., et al. 2021, A&A, 656, A132 [NASA ADS] [CrossRef] [EDP Sciences] [Google Scholar]
- Trümper, J., Hasinger, G., Aschenbach, B., et al. 1991, Nature, 349, 579 [Google Scholar]
- Turner, M. J. L., Abbey, A., Arnaud, M., et al. 2001, A&A, 365, L27 [CrossRef] [EDP Sciences] [Google Scholar]
- Valdes, F. 2021, The DECam Community Pipeline Instrumental Signature Removal, https://noirlab.edu/science/index.php/data-services/data-reduction-software/csdc-mso-pipelines/pl206 [Google Scholar]
- van den Heuvel, E. P. J., Bhattacharya, D., Nomoto, K., & Rappaport, S. A. 1992, A&A, 262, 97 [Google Scholar]
- Wilms, J., Allen, A., & McCray, R. 2000, ApJ, 542, 914 [Google Scholar]
All Tables
All Figures
 |
Fig. 1. Region around eRASSU J060839.5−704014 extracted from the full RGB mosaic of the EPIC LMC observations showing the source (white) and background extraction circles (green). |
| In the text | |
 |
Fig. 2. eROSITA 0.2−2 keV light curves of eRASSU J060839.5−704014. The black points represent a single scan. The count rates of bins with fewer than ten counts are plotted as 1σ upper limits. The total light curve of eRASS1–4 is shown left, with a zoomed-in view covering eRASS1 on the right. |
| In the text | |
 |
Fig. 3. Lomb-Scargle periodograms of the eRASS1–4 light curve showing the periodicities at 7.77 and 8.21 h (left) and at 6.7 days (right). The dashed red line marks the 99% confidence level. |
| In the text | |
 |
Fig. 4. Lomb-Scargle periodogram of eRASSU J060839.5−704014 obtained from the combined XMM-Newton data (0.2−1.0 keV). Pulsations are detected with of period of 374 s. The dashed red line marks the 99.73% confidence level obtained by the block-bootstrapping method. |
| In the text | |
 |
Fig. 5. Background-subtracted and combined XMM-Newton light curve folded with the best-fitted period showing the pulse profile of eRASSU J060839.5−704014 in the energy band of 0.2−1 keV. The pulse profile is normalised to the mean count rate of 0.21 cts s−1. The vertical lines show the interval taken as on-pulse for phase-resolved spectroscopy. |
| In the text | |
 |
Fig. 6. Corner plot of the model fitted to the eROSITA data. Pref is the reference time compared to the time of the first eROSITA point of the data set, i.e. MJD 58921.70648. |
| In the text | |
 |
Fig. 7. Comparison of the eROSITA data (red points) with the predictions of the aliasing model (dashed blue line). For plotting purposes we have connected the model points, although this bears no physical meaning. |
| In the text | |
 |
Fig. 8. Corner plot of the posterior distributions for the eRASS:4 spectral fit with a single NH model. NH is in units of 1022 atoms cm−2. |
| In the text | |
 |
Fig. 9. Spectral fit of eRASSU J060839.5−704014 using the eROSITA spectrum from eRASS:4 (top) and EPIC-pn (bottom) together with the posterior distributions of model parameters. The spectrum for each eRASS was extracted by combining data from the TMs with an on-chip filter. See Table 2 for the model parameters. Darker and lighter bands enclose the 68% and 95% posterior uncertainties on the model at each energy. |
| In the text | |
 |
Fig. 10. Corner plot of the posterior distributions for the XMM-Newton EPIC-pn spectral fit with a single NH and after adding the bremsstrahlung component. NH is in units of 1022 atoms cm−2. |
| In the text | |
 |
Fig. 11. Optical images around eRASSU J060839.5−704014. Top: GROND g′ band image. The large white circle (radius 5″) marks the eROSITA error circle and the red circle indicates the 1σ position uncertainty obtained from the XMM-Newton/EPIC X-ray images. The small white circle marks the position of the proposed optical counterpart. The three nearest Gaia objects are marked, demonstrating the good astrometric quality of the XMM-Newton data. Bottom: zoomed-in archival DECam image centred on the optical counterpart from the top figure. The image is produced from a number of exposures, which were co-added to create the individual filter images for the presented colour composite. The data are taken from the Legacy Survey release 10 (DR10). |
| In the text | |
 |
Fig. 12. Optical IR (DECam) flux density of eRASSU J060839.5−704014 (blue dots) with the best-fit black-body spectrum in red and a power law overplotted in blue. The UV fluxes from GALEX are plotted as upper limits (in orange) as they were contaminated by a nearby bright object and were not used for the fit. Also overplotted is a black-body spectrum with a temperature of 27 000 K in green, as obtained for the case of the DD system RX J0806.3+1527 (Esposito et al. 2014). |
| In the text | |
 |
Fig. 13. Long-term X-ray light curve of eRASSU J060839.5−704014 for the 0.2−2 keV band. The mean value of all observations from eRASS1–4 is marked in red and our XMM-Newton pointed observation in blue. The two sources from the clean XMMSL2 catalogue are marked with a black “+”. The black “×” marks the slew observation that belongs to our XMM-Newton pointed observation. A black-body model with a temperature of 100 eV was used for flux conversion for the data from the upper limit server, i.e. for Einstein, ROSAT and XMM-Newton slew data. The 1σ errors are given for ROSAT and XMM-Newton slew data, and the Einstein upper limit is given with a 99.7% confidence level. Errors for XMM-Newton pointed and eROSITA data have 90% confidence intervals. |
| In the text | |
Current usage metrics show cumulative count of Article Views (full-text article views including HTML views, PDF and ePub downloads, according to the available data) and Abstracts Views on Vision4Press platform.
Data correspond to usage on the plateform after 2015. The current usage metrics is available 48-96 hours after online publication and is updated daily on week days.
Initial download of the metrics may take a while.


