Fig. 5.
Download original image
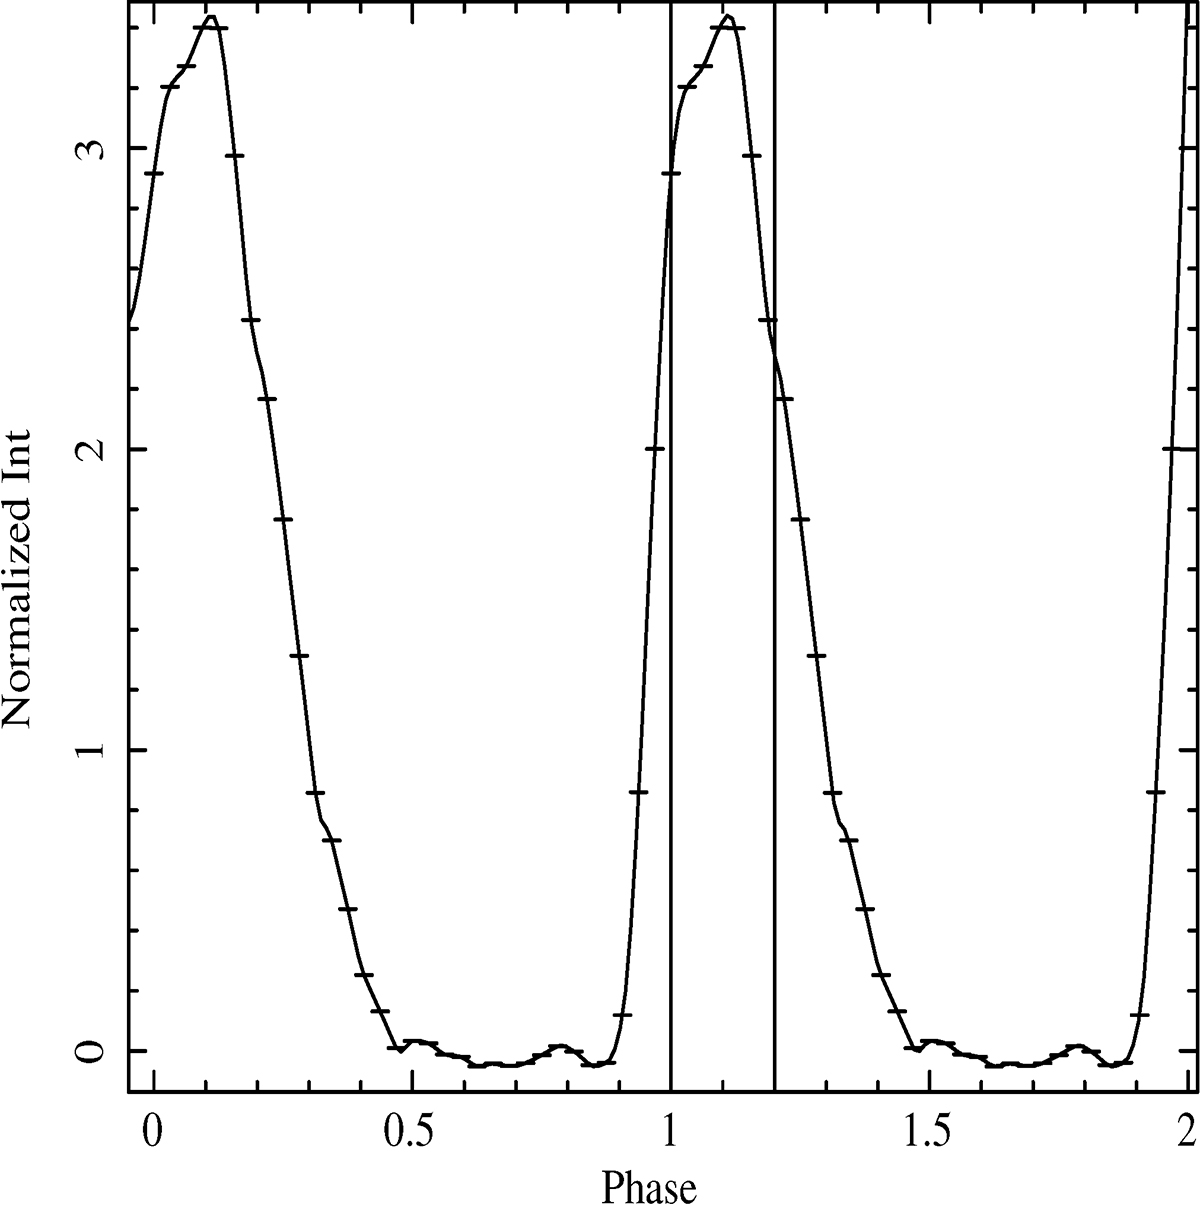
Background-subtracted and combined XMM-Newton light curve folded with the best-fitted period showing the pulse profile of eRASSU J060839.5−704014 in the energy band of 0.2−1 keV. The pulse profile is normalised to the mean count rate of 0.21 cts s−1. The vertical lines show the interval taken as on-pulse for phase-resolved spectroscopy.
Current usage metrics show cumulative count of Article Views (full-text article views including HTML views, PDF and ePub downloads, according to the available data) and Abstracts Views on Vision4Press platform.
Data correspond to usage on the plateform after 2015. The current usage metrics is available 48-96 hours after online publication and is updated daily on week days.
Initial download of the metrics may take a while.