Open Access
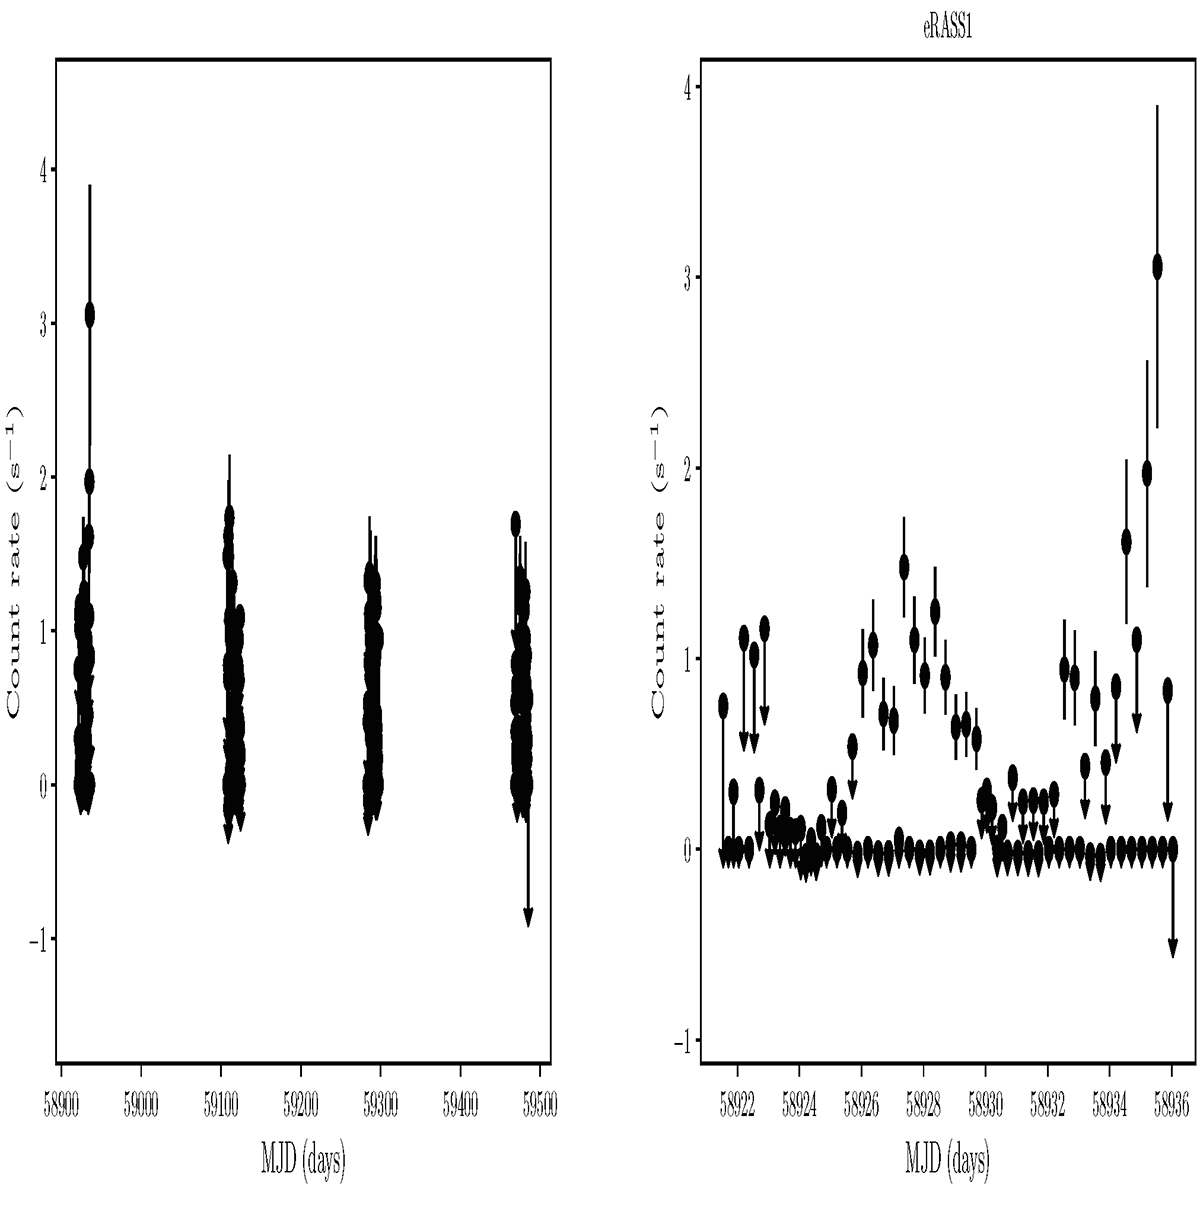
Fig. 2.
Download original image
eROSITA 0.2−2 keV light curves of eRASSU J060839.5−704014. The black points represent a single scan. The count rates of bins with fewer than ten counts are plotted as 1σ upper limits. The total light curve of eRASS1–4 is shown left, with a zoomed-in view covering eRASS1 on the right.
Current usage metrics show cumulative count of Article Views (full-text article views including HTML views, PDF and ePub downloads, according to the available data) and Abstracts Views on Vision4Press platform.
Data correspond to usage on the plateform after 2015. The current usage metrics is available 48-96 hours after online publication and is updated daily on week days.
Initial download of the metrics may take a while.