| Issue |
A&A
Volume 597, January 2017
|
|
|---|---|---|
| Article Number | A72 | |
| Number of page(s) | 7 | |
| Section | Interstellar and circumstellar matter | |
| DOI | https://doi.org/10.1051/0004-6361/201527820 | |
| Published online | 03 January 2017 | |
Mid-IR water and silicate relation in protoplanetary disks
1 Kapteyn Astronomical
Institute, Postbus
800, 9700 AV
Groningen, The
Netherlands
e-mail: This email address is being protected from spambots. You need JavaScript enabled to view it.
2 Centro de Astrobiología (INTA-CSIC) –
Depto. Astrofísica, POB 78, ESAC Campus, 28691
Villanueva de la Cañada,
Spain
3 SRON Netherlands Institute for Space
Research, PO Box
800, 9700 AV
Groningen, The
Netherlands
4 Max-Planck-Institut für
extraterrestrische Physisk, Giessenbachstrasse 1, 85748
Garching,
Germany
5 St. Andrews University, School of
Physics and Astronomy, St.
Andrews
KY16 9SS,
UK
6 Leiden Observatory, Leiden
University, PO Box, 2300
RA
Leiden, The
Netherlands
7 INAF–Osservatorio Astronomico di
Cagliari, via della Scienza 5, 09047
Selargius,
Italy
Received:
24
November
2015
Accepted:
26
October
2016
Abstract
Context. Mid-IR water lines from protoplanetary disks around T Tauri stars have a detection rate of 50%. Models have identified multiple physical properties of disks such as dust-to-gas mass ratio, dust size power law distribution, disk gas mass, disk inner radius, and disk scale height as potential explanations for the current detection rate.
Aims. In this study, we aim to break degeneracies through constraints obtained from observations. We search for a connection between mid-IR water line fluxes and the strength of the 10 μm silicate feature.
Methods. We analyze observed water line fluxes from three blends at 15.17, 17.22 and 29.85 μm published earlier and compute the 10 μm silicate feature strength from Spitzer spectra to search for possible trends. We use a series of published ProDiMo thermo-chemical models, to explore disk dust and gas properties, and also the effects of different central stars. In addition, we produced two standard models with different dust opacity functions, and one with a parametric prescription for the dust settling.
Results. Our series of models that vary properties of the grain size distribution suggest that mid-IR water emission anticorrelates with the strength of the 10 μm silicate feature. The models also show that the increasing stellar bolometric luminosity simultaneously enhance the strength of this dust feature and the water lines fluxes. No correlation is found between the observed mid-IR water lines and the 10 μm silicate strength. Two-thirds of the targets in our sample show crystalline dust features, and the disks are mainly flaring. Our sample shows the same difference in the peak strength between amorphous and crystalline silicates that was noted in earlier studies, but our models do not support this intrinsic difference in silicate peak strength. Individual properties of our models are not able to reproduce the most extreme observations, suggesting that more complex dust properties (e.g., vertically changing) are required to reproduce the strongest 10 μm silicate features. A parametrized settling prescription is able to boost the peak strength by a factor of 2 for the standard model. Water line fluxes are unrelated to the composition of the dust. The pronounced regular trends seen in the model results are washed out in the data due to the larger diversity in stellar and disk properties compared to our series of model.
Conclusions. The independent nature of the water line emission and the 10 μm silicate strength found in observations, and the modeling results, leave as a possible explanation that the disks with weaker mid-IR water line fluxes are depleted in gas or enhanced in dust in the inner 10 au. In the case of gas depleted disks, settling produces very strong 10 μm silicate features with strong peak strength. Observations of larger unbiased samples with JWST/MIRI and ALMA are essential to verify this hypothesis.
Key words: protoplanetary disks / line: formation / stars: pre-main sequence / circumstellar matter
© ESO 2017
1. Introduction
Water has been observed in protoplanetary disks from the near-IR (Salyk et al. 2008), through the mid-IR (Carr & Najita 2008; Pontoppidan et al. 2010a,b), to the far-IR (Hogerheijde et al. 2011; Podio et al. 2013; Riviere-Marichalar et al. 2012). The main water reservoir, with an abundance of 10-4 with respect to the total hydrogen number density, is located in the inner few au; this reservoir is responsible for water emission below 30 μm. A survey of mid-IR water lines has produced a complex picture: the detection rate of about 50% for T Tauri and 5% for Herbig stars (Pontoppidan et al. 2010a). Our previous work (Antonellini et al. 2015) found that the continuum opacity due to differences in dust properties is one of the main reasons for changing the strength of the mid-IR water emission. In a subsequent paper (Antonellini et al. 2016), we explain the non-detections of mid-IR water lines around early-type pre-main-sequence stars (PMSs), with the stronger mid-IR continuum and instrumental noise.
Dust is assumed to constitute only 1% of the disk mass, but it is a bolometric source of opacity able to suppress line fluxes. Dust also plays a role in the thermal balance of the disk, due to the photoelectric effect. In environments such as protoplanetary disks, dust grains grow (as inferred from mm flux and spectral indexes, Beckwith et al. 1990; Mannings & Sargent 2000; Andrews & Williams 2005, 2007) and settle (D’Alessio et al. 1999; Chiang et al. 2001). Silicate grains produce two solid state features around 10 and 20 μm. The features originate mainly from μm-sized grains where the dust temperature is around 200–600 K (Natta et al. 2007). The 10 μm feature hosts information about the thermal and physical history of dust grains, and also the composition (Kessler-Silacci et al. 2005). According to van Boekel et al. (2005), the more the dust is processed (crystallized), the wider the feature and the lower the peak strength. The strength of the 10 μm peak is also inversely correlated with the dust grain size. Bouwman et al. (2008) has found a correlation between the shape of the 10 μm amorphous feature and the SED shape, that is consistent with both dust growth and subsequent settling. Turbulent mixing, however, seems efficient in maintaining μm-sized grains in the atmospheres of T Tauri disks (Olofsson et al. 2009). Mass transport can also explain the presence of a relevant fraction of cold crystallized dust in disks around T Tauri stars (Olofsson et al. 2010). The correlations found between crystalline indexes and continuum spectral indexes considered in Watson et al. (2009) are consistent with the larger mass of crystalline silicates found in settled disks. In our previous work (Antonellini et al. 2015), we found the continuum opacity to be a main factor in IR water spectroscopy. The dust opacity depends on the size of the dust (both in terms of maximum size and size distribution) and its composition. Typical spectral features of silicates in mid-IR spectra are at ~10μm and ~18μm; the exact wavelength depends on the composition (Jäger et al. 2003). The shape and intensity of these features are also related to the dust composition and size properties (e.g. Jaeger et al. 1994; Chiang et al. 2001; Bouwman et al. 2001; Min et al. 2011). This suggests the potential of a relation between the strength/shape of the strongest dust silicate feature (the 10μm) and the mid-IR water lines. The presence of this correlation could open the possibility of a new diagnostic tool for the inner disk properties.
Water lines and the silicate features both arise from the inner disk. Hence, in this paper we investigate a potential relation between the mid-IR water lines and the 10 μm silicate feature strength. We investigate this in the context of the thermo-chemical modeling results by Antonellini et al. (2015, 2016) and compare these findings to a sample of disks observed with Spitzer.
2. Spitzer spectra
We analyze in this work Spitzer-IRS high (R = 600) and low resolution (R ≲ 120) spectra of a sample of T Tauri stars. We considered T Tauri stars for which measurements of line fluxes for the blends at 15.17 μm, 17.22 μm, and 29.85 μm, are available from Pontoppidan et al. (2010a). We then took spectra from the CASSIS database1 and reduced BCD data from the Spitzer archive2. We reduced the second set of high resolution data following a pipeline developed by the c2d team (Evans et al. 2009), and applyied the PSF extraction procedure (Lahuis et al. 2007; Lahuis 2007). The data were then post-processed by applying defringing (Lahuis & Boogert 2003) to remove residuals due to low-level fringes. Spectra from CASSIS are all low resolution, and already reduced following a pipeline described in detail in Lebouteiller et al. (2011). The two pipelines produce spectra of comparable quality beside the different resolution.
The strength of the 10 μm silicate feature Sλ,peak is computed as 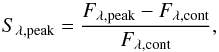 (1)where Fλ is the flux at 10 μm and Fλ,cont is the local linearly fitted continuum. The error computation is taken from the covariance matrix of the fitting function3.
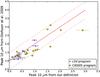 |
Fig. 1 Comparison of the peak strength definition adopted in our work and that obtained by Olofsson et al. (2009). Blue stars are data extracted from c2d program Spitzer spectra (Evans et al. 2009), while yellow squares are data extracted from CASSIS (Lebouteiller et al. 2011) Spitzer spectra. The red solid line is the reference. Dot-dashed lines indicate a 50% deviation from the one-to-one relation. Olofsson et al. (2009) data are based on c2d spectra and do not contain errors. |
The definition of silicate peak strength adopted in this work differs from that used in Olofsson et al. (2009), which is based on Kessler-Silacci et al. (2006). There, the peak strength is defined as 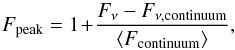 (2)where Fν is the spectral flux at the frequency of the peak, Fν,continuum is the fitted value for the continuum at the peak frequency, and ⟨Fcontinuum⟩ is the average continuum in the fitted wavelength range ~7–14 μm; the exact range of the fit is a function of the data range and SED slope. In addition to the +1 shift in the value of the peak (which systematically produces larger peak values with respect to our definition), the definition of the average continuum can produce a slight difference in the ratio, in particular in cases where our fitted range differs from the one adjusted for each specific case.
Figure 1 shows that our definition produces systematically weaker peak fluxes, but the deviation scatter from the red line is around one. In some cases, our selected spectra are from a different program, and some of the targets are known to be variable in the mid-IR. Olofsson et al. (2009) fluxes are from c2d spectra, and their values agree more closely with our peak fluxes in the case where we used c2d spectra as well. Agreement between the two peak strength definitions is on average better than 13%, meaning that any conclusion produced will be valid independently of the definition used for the silicate feature strength.
Individual targets, have different spectral types and luminosities; in our sample, the range of luminosity spans from 0.26 to 2.6 L⊙. To make a direct comparison between the observations and our models (which are built around a typical K7 star with L∗ = 0.7 L⊙), we divided the mid-IR water line fluxes by the local continuum flux.
3. Modeling water and silicates
We perform a parameter space exploration using a sub-series of the models presented in Antonellini et al. (2015, 2016), considering parameters significantly affecting mid-IR water line fluxes and dust peak strength at 10 μm (Table 1). These are 2D radiation thermo-chemical models, with continuous disk structure, and non-LTE line radiative transfer. The series are built by changing a single parameter each time. These models include a prescription of the dust settling based on Dubrulle et al. (1995). The disk dust composition of our models is based on a mixture of 80% amorphous silicates and 20% carbonaceous dust species with average ρ = 3.5 g/cm3 (Draine & Lee 1984), and the dust size distribution is based on a power law extending from a minimum (fixed for all the models amin = 0.05 μm) to a maximum size (listed in Table 1). From these models, we produced high resolution Spitzer spectra, and we extract the water blend fluxes at 15.17, 17.22, and 29.85 μm by adopting the same procedure as described in Pontoppidan et al. (2010a). Finally we also computed the peak strength of the 10 μm silicate feature using Eq. (1).
Disk parameters series.
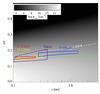 |
Fig. 2 Emitting region of the 10 μm continuum emission and the strongest water lines contributing to the 15.17 μm, 17.22 μm, and 29.85 μm blends for our typical T Tauri disk model. The emitting regions include 15–85% of the radial and vertical integrated flux at the given wavelengths. The green dashed line marks the optical extinction level AV = 1 mag. The white dashed line marks the Tgas = 600 K contour. |
Figure 2 shows that these two spectral features are emitted from the same region in our standard T Tauri model, and so they arise under the same physical and thermal conditions. Hence, we consider the 10 μm peak strength as an indicator of the continuum opacity in the 10–20 μm water emitting region in disks. The 29.85 μm blend is emitted from larger radii compared to the silicate feature, but there is a partial overlap and so the idea also holds for this blend.
Figure 3 describes the results from four different series of models. The first two series we explored (1 and 2 in Table 1) directly produce an effect on the abundance of μm-sized grains. Extending the maximum dust size while maintaining constant the dust mass and the power law index of the size distribution reduces the population of small grains. As a consequence the strength of the 10 μm feature becomes weaker. Reducing the value of the dust size power law distribution index has the effect of putting more of the dust mass into large particles, and this again reduces the population of small grains. Finally, the effect of changing the gas mass (series 3) is more indirect. It is related to the radial temperature profile due to the presence or absence of large grains in the upper disk layers. If Mgas is low, big grains settle to the midplane, and the small grains in the upper layers are more exposed to the stellar irradiation, due to the partially reduced opacity. Our models show clearly that for a fixed dust composition, changing any of the individual disk properties (1, 2, 3 in Table 1), water blend fluxes anti-correlate with the 10 μm silicate peak flux. Instead, models with different luminosities of the central star (series 4) show simultaneously stronger mid-IR water and silicate feature with increasing stellar luminosity (Fig. 3).
If we analyze our models with different Mgas, we find a sharp transition at our canonical model (Mgas = 0.01 M⊙; Fig. 3). Models with larger gas mass, show stronger mid-IR water lines at fixed 10 μm peak strength and the blend emitting regions are moved outward by up to 1 au and slightly upward with respect to the 10 μm silicate emitting region in the disk. Models below a gas mass of 0.001 M⊙ show no detectable mid-IR water lines (now emitted inward of 0.2 au) and a stronger 10 μm peak. This is due to the strong settling (because of the lack of gas support), that reduces the number of larger grains in the upper layers. In our prescription for the dust settling (Dubrulle et al. 1995), the dust vertical scale height depends on the gas density. In the inner disk, grains are always unsettled in models with a significant amount of gas mass (Mgas ≥ 0.01 M⊙). Only in cases of very low gas mass does the settling become important even in the inner disk. In this case, the emission at 10 μm becomes purely driven by small grains, which produce a much stronger emission feature. A similar effect can be obtained in the models by changing the amount of dust in the disk.
Our standard description for the dust opacity is based on interstellar silicates, while our target list suggests that dust composition is different in protoplanetary disks. To study the effect of a different dust composition, we perform two additional tests on our standard disk model using different opacity functions: fully crystalline dust grains (labeled Forsterite in Fig. 3) and DIANA standard opacities (60% forsterite, 15% amorphous carbon, 25% vacuum; labelled DIANA in Fig. 3, details can be found in Min et al. 2016). The two different opacity functions produce a very similar shape of the 10 μm feature, suggesting that the crystallinity degree alone is not able to reproduce the most extreme observations of peak strength in our sample. The increased opacity of the DIANA standard case suppresses mid-IR water line strength by about a factor of two.
Given that our physical settling prescription is not able to affect the inner disk, we performed an additional test using a parametrized prescription for the settling, in which only dust grains above a certain size are settled, according to  (3)where cs(z,a) is the sound speed used to compute the scale height of dust of size a at the height z above the midplane, asettle is the size threshold above which dust starts to be settled, and esettle is an exponent that modulates the size dependency of vertical settling. In our test we used asettle = 1 μm and a very extreme value for esettle, which is set to 1, four times larger than the value adopted in Kamp et al. (2011). A different settling prescription, which affects even the inner disk, produces peak values of the silicate feature only a factor two stronger, while the mid-IR water line flux is almost unaffected, because smaller grains (main carrier of the continuum opacity), are still up in the disk layers from which the mid-IR water lines are emitted.
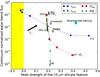 |
Fig. 3 Representative ratio of water blend to continuum (15.17 μm) versus the 10 μm silicate feature for four series of models. The blue dot models have a different dust size power law distribution index. The green diamond models have a different maximum dust size. The red square models have a different gas mass. The cyan triangle models have a different dust-to-gas ratio. Extreme values for each series are labeled. The shift in the plot produced by models with different Lstar is shown by the black arrow. The yellow shading is the region where the 10 μm features are in absorption and the peak fluxes become negative. The gold star indicates the standard disk model with the DIANA opacity function, and the silver star the model with the fully crystalline dust opacity function. The cyan hexagon indicates the model with the parametrized settling prescription. |
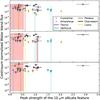 |
Fig. 4 Water blend fluxes (top 15.17 μm, middle 17.22 μm, bottom 29.85 μm) divided by the local continuum flux versus 10 μm silicate feature peak strength. Diamonds are targets with crystalline dust features (F11.3/F9.8>0.71), crosses are for the amorphous grains. The color coding is based on the ratio F30/F13 reported in Oliveira et al. (2010). Magenta objects are flat disks (ratio below 1.5), cyan are flared objects, yellow are cold disks and brown are edge-on targets (ratio above 15). Black targets are the ones for which this ratio is not available. Arrows indicates upper limit measurements. The shaded pink boxes encircle the area covered in all of our models. |
4. Mid-infrared water and silicate relation
We decided to plot our available observations for the mid-IR water line fluxes, against the computed 10 μm silicate peak strength. Figure 4 shows the ratio of water blend to continuum flux, versus the 10 μm silicate peak strength for a sample of T Tauri star disks listed in Table A.1 for which the Spitzer spectrum was available (Sect. 2). There is no clear correlation between mid-IR water line fluxes and the peak strength of the 10 μm silicate feature, contrary to what we find in several model series. A possible reason could be the diversity of the sample, since the data are from disks with different central star, dust compositions and geometry.
We classified our observed sample in order to discover possible trends with different geometry or dust properties. At first, we considered the different outer disk scale height and flaring as possible discriminators, based on the mid-IR slope F30/F13 and on the classification reported in Oliveira et al. (2010). Almost all of our targets are flared disks (cyan objects in Fig. 4), with a few cases of cold disks or edge-on objects. We determined the crystallinity degree, adopting the criterium used in (van Boekel et al. 2005; and Bouwman et al. 2008), that crystalline dust grains have F11.3/F9.8> 0.71. We find that 2/3 of our targets have crystalline dust grains, and there is no correlation between crystallinity and disk geometry. Disks with crystalline silicates seem to cluster in a region of smaller silicate peak fluxes.
The observations are unfortunately affected by large error bars for the 10 μm peak, and several upper limits for water blend fluxes (Fig. 4). This is due to the sometimes low S/N of the Spitzer spectra, and it prevents us from drawing clear conclusions regarding correlations in the data.
Due to the more balanced distribution of the number of targets with amorphous (10 objects) and crystalline (23 objects) dust grains, we use a basic statistical test to investigate the existence of two distinct groups of objects with different mid-IR water line fluxes and silicate feature strength. We perform a Kolmogorov-Smirnov analysis, an Anderson-Darling test, and a Mantel-Haenszel statistical test (for data with upper limits), using either R code4 or python5. According to the results from these tests, we find that the 10 μm peaks do not pertain to the same distributions, but can be statistically classified in the groups of amorphous and crystalline. However, the water line fluxes observed in disks with both types of dust grains pertain to the same distribution (Table 2). This result suggests that different levels of 10 μm peak strength (and so the crystallinity of dust) are not behind the differences in water blend strength. We can conclude from the Kolmogorov-Smirnov and the Mantel-Haenszel statistics that water blend fluxes at this wavelength are clearly unaffected by 10 μm peak strength. Because the distributions of water emission for amorphous and crystalline grains seem to be drawn from the same distribution indicates that the two observables are independent (water line fluxes and crystallinity). Since we took the 10 μm peak strength as a proxy for the local dust opacity in the water emitting region, we tentatively conclude that opacity does not directly suppress the mid-IR flux.
Kolmogorov-Smirnov, Anderson-Darling, and Mantel-Haenszel test results.
5. Comparison between observations and models
Our model series 2 and 3 clearly predict an anticorrelation between the strength of the 10 μm silicate feature and mid-IR water line fluxes; however, this is not observed in our data sample. Possible reasons for the apparent non-correlation are the complexity of individual objects, that can be described only by a proper combination of our model series parameters. Also, our sample is very limited, and additional observations should be included to enlarge the sample by at least a factor of 3. This implies getting future spectra from JWST/MIRI (5–28 μm) with greater sensitivity and spatial resolution in order to improve the statistics and in order to allow the construction of a more homogeneous sample, e.g., focus on single spectral type, same disk mass. Considering purely the observations, we can only confirm the presence of two distinct populations in which disks with crystalline dust have peak strengths lower than 1.1.
The range of mid-IR water line fluxes covered by the models overlaps well with the observations, but this is not the case for the 10 μm silicate feature strength. Our series of models underestimate the value of the 10 μm peak strength, which can be up to 3 in the observations. The models able to produce strongest peak values have very steep dust size power law distributions and/or very low gas content. Different opacity functions, using different degrees of crystallization, are not enough to boost the peak strength up to the extreme observations we have. As discussed in Sect. 3, the more physical settling prescription does not allow dust to settle in the inner disk and hence does not cover the high end of observed silicate peak strength (series 3). By adopting an alternative settling prescription that forces dust above a certain size threshold to settle, we produce a greater peak strength for our standard model. This could indicate the presence of strong dust settling in certain disks that is beyond the physical description provided by Dubrulle et al. (1995).
Objects with very strong 10 μm peaks show systematically lower mid-IR water line fluxes; however, there are very few objects with such high silicate peaks limiting our statistics. According to our model results trend, these targets could have a lower gas mass or a particularly high dust content in the innermost disk regions where planet formation occurs. Disks in which planet formation happens can also experience amorphization of dust grains (Watson et al. 2009). This is consistent with the fact that in our data sample, disks with amorphous dust grains have stronger 10 μm peak strength.
Currently, ALMA high spatial resolution observations could investigate whether some of the disks with strong water emission are indeed dust depleted in the inner 10 au.
6. Conclusions
Some of our model series (1, 2, 3, 4) suggest the presence of a regular trend between the strength of the 10 μm silicate dust feature and the mid-IR water blend fluxes. This is directly related to changing dust opacity. A stronger silicate feature is produced by disk properties such as very small dust grains, very steep power law dust size distribution, or very low gas mass. It is an indicator of larger continuum opacity and leads to weaker mid-IR water lines. Dust grains and water both behave in the same manner with respect to the stellar bolometric luminosity (series 5) since both gas and (in particular) dust get warmer.
Observational samples are likely more heterogeneous than what our models currently describe. Disks around T Tauri stars show mainly processed and more crystalline dust, while our modeling is performed with ISM dust (mainly amorphous). The two alternative cases of dust opacity function that we explored cannot explain observed peak strength greater than 1. A test performed with a parametric description of settling shows that our models systematically shift to a peak strength larger by about 0.2 if the inner disk would is settled.
Observations are consistent with relatively flared disks around T Tauri stars and crystalline dust features. From statistical tests, we found that the peak strength is different in disks with amorphous and crystalline grains. We also found that the water line fluxes in the two samples of amorphous and crystalline silicate disks are indistinguishable. This suggests that dust opacity due to the different composition does not drive the difference in mid-IR water fluxes. The independent behavior of these two observables and the results from models of extremely settled disks provide an alternative explanation, namely that some disks have an inner ring within 10 au enhanced in dust or depleted in gas that is experiencing strong settling. High spatial resolution observations (ALMA, JWST) are needed to confirm this hypothesis.
The Cornell Atlas of Spitzer/IRS Sources (CASSIS) is a product of the Infrared Science Center at Cornell University, supported by NASA and JPL.
Acknowledgments
We thank Aaron Greenwood for the language editing and precious suggestions about how to improve the clarity of the paper. We thank Klaus Pontoppidan and Jeroen Bouwman for productive and fruitful discussions on the topic of this paper. The research leading to these results has received funding from the European Union Seventh Framework Programme FP7-2011 under grant agreement No. 284405.
References
- Andrews, S. M., & Williams, J. P. 2005, ApJ, 631, 1134 [NASA ADS] [CrossRef] [Google Scholar]
- Andrews, S. M., & Williams, J. P. 2007, ApJ, 671, 1800 [CrossRef] [Google Scholar]
- Antonellini, S., Kamp, I., Riviere-Marichalar, P., et al. 2015, A&A, 582, A105 [NASA ADS] [CrossRef] [EDP Sciences] [Google Scholar]
- Antonellini, S., Kamp, I., Lahuis, F., et al. 2016, A&A, 585, A61 [NASA ADS] [CrossRef] [EDP Sciences] [Google Scholar]
- Beckwith, S. V. W., Sargent, A. I., Chini, R. S., & Guesten, R. 1990, AJ, 99, 924 [NASA ADS] [CrossRef] [Google Scholar]
- Blevins, S. M., Pontoppidan, K. M., Banzatti, A., et al. 2016, ApJ, 818, 22 [NASA ADS] [CrossRef] [Google Scholar]
- Bouwman, J., Meeus, G., de Koter, A., et al. 2001, A&A, 375, 950 [NASA ADS] [CrossRef] [EDP Sciences] [Google Scholar]
- Bouwman, J., Henning, T., Hillenbrand, L. A., et al. 2008, ApJ, 683, 479 [NASA ADS] [CrossRef] [Google Scholar]
- Carr, J. S., & Najita, J. R. 2008, Science, 319, 1504 [NASA ADS] [CrossRef] [PubMed] [Google Scholar]
- Chiang, E. I., Joung, M. K., Creech-Eakman, M. J., et al. 2001, ApJ, 547, 1077 [NASA ADS] [CrossRef] [Google Scholar]
- D’Alessio, P., Calvet, N., Hartmann, L., Lizano, S., & Cantó, J. 1999, ApJ, 527, 893 [NASA ADS] [CrossRef] [Google Scholar]
- Draine, B. T., & Lee, H. M. 1984, ApJ, 285, 89 [Google Scholar]
- Dubrulle, B., Morfill, G., & Sterzik, M. 1995, Icarus, 114, 237 [NASA ADS] [CrossRef] [Google Scholar]
- Evans, II, N. J., Dunham, M. M., Jørgensen, J. K., et al. 2009, ApJS, 181, 321 [NASA ADS] [CrossRef] [Google Scholar]
- Hogerheijde, M. R., Bergin, E. A., Brinch, C., et al. 2011, Science, 334, 338 [NASA ADS] [CrossRef] [PubMed] [Google Scholar]
- Jaeger, C., Mutschke, H., Begemann, B., Dorschner, J., & Henning, T. 1994, A&A, 292, 641 [Google Scholar]
- Jäger, C., Dorschner, J., Mutschke, H., Posch, T., & Henning, T. 2003, A&A, 408, 193 [NASA ADS] [CrossRef] [EDP Sciences] [Google Scholar]
- Kamp, I., Woitke, P., Pinte, C., et al. 2011, A&A, 532, A85 [NASA ADS] [CrossRef] [EDP Sciences] [Google Scholar]
- Kessler-Silacci, J. E., Hillenbrand, L. A., Blake, G. A., & Meyer, M. R. 2005, ApJ, 622, 404 [Google Scholar]
- Kessler-Silacci, J., Augereau, J.-C., Dullemond, C. P., et al. 2006, ApJ, 639, 275 [NASA ADS] [CrossRef] [Google Scholar]
- Lahuis, F. 2007, Ph.D. Thesis, Leiden Observatory, Leiden University, The Netherlands [Google Scholar]
- Lahuis, F., & Boogert, A. 2003, in SFChem 2002: Chemistry as a Diagnostic of Star Formation, Proc. of Conf., August 21–23, 2002, eds. C. L. Curry, & M. Fich (Ottawa, Canada: NRC Press), 335 [Google Scholar]
- Lahuis, F., van Dishoeck, E. F., Blake, G. A., et al. 2007, ApJ, 665, 492 [NASA ADS] [CrossRef] [Google Scholar]
- Lebouteiller, V., Barry, D. J., Spoon, H. W. W., et al. 2011, ApJS, 196, 8 [NASA ADS] [CrossRef] [Google Scholar]
- Mannings, V., & Sargent, A. I. 2000, ApJ, 529, 391 [NASA ADS] [CrossRef] [Google Scholar]
- Min, M., Dullemond, C. P., Kama, M., & Dominik, C. 2011, Icarus, 212, 416 [NASA ADS] [CrossRef] [Google Scholar]
- Min, M., Rab, C., Woitke, P., Dominik, C., & Ménard, F. 2016, A&A, 585, A13 [NASA ADS] [CrossRef] [EDP Sciences] [Google Scholar]
- Natta, A., Testi, L., Calvet, N., et al. 2007, Protostars and Planets V, 767 [Google Scholar]
- Oliveira, I., Pontoppidan, K. M., Merín, B., et al. 2010, ApJ, 714, 778 [NASA ADS] [CrossRef] [Google Scholar]
- Olofsson, J., Augereau, J.-C., van Dishoeck, E. F., et al. 2009, A&A, 507, 327 [NASA ADS] [CrossRef] [EDP Sciences] [Google Scholar]
- Olofsson, J., Augereau, J.-C., van Dishoeck, E. F., et al. 2010, A&A, 520, A39 [NASA ADS] [CrossRef] [EDP Sciences] [Google Scholar]
- Podio, L., Kamp, I., Codella, C., et al. 2013, ApJ, 766, L5 [NASA ADS] [CrossRef] [Google Scholar]
- Pontoppidan, K. M., Salyk, C., Blake, G. A., & Käufl, H. U. 2010a, ApJ, 722, L173 [NASA ADS] [CrossRef] [Google Scholar]
- Pontoppidan, K. M., Salyk, C., Blake, G. A., et al. 2010b, ApJ, 720, 887 [NASA ADS] [CrossRef] [Google Scholar]
- Rigliaco, E., Pascucci, I., Duchene, G., et al. 2015, ApJ, 801, 31 [NASA ADS] [CrossRef] [Google Scholar]
- Riviere-Marichalar, P., Ménard, F., Thi, W. F., et al. 2012, A&A, 538, L3 [NASA ADS] [CrossRef] [EDP Sciences] [Google Scholar]
- Salyk, C., Pontoppidan, K. M., Blake, G. A., et al. 2008, ApJ, 676, L49 [NASA ADS] [CrossRef] [Google Scholar]
- Salyk, C., Blake, G. A., Boogert, A. C. A., & Brown, J. M. 2011a, ApJ, 743, 112 [NASA ADS] [CrossRef] [Google Scholar]
- Salyk, C., Pontoppidan, K. M., Blake, G. A., Najita, J. R., & Carr, J. S. 2011b, ApJ, 731, 130 [NASA ADS] [CrossRef] [Google Scholar]
- van Boekel, R., Min, M., Waters, L. B. F. M., et al. 2005, A&A, 437, 189 [NASA ADS] [CrossRef] [EDP Sciences] [Google Scholar]
- Watson, D. M., Leisenring, J. M., Furlan, E., et al. 2009, ApJS, 180, 84 [NASA ADS] [CrossRef] [Google Scholar]
Appendix A: Observational data
Table A.1 lists the observations used in this study.
Selected T Tauri disk system.
All Tables
All Figures
|
Fig. 1 Comparison of the peak strength definition adopted in our work and that obtained by Olofsson et al. (2009). Blue stars are data extracted from c2d program Spitzer spectra (Evans et al. 2009), while yellow squares are data extracted from CASSIS (Lebouteiller et al. 2011) Spitzer spectra. The red solid line is the reference. Dot-dashed lines indicate a 50% deviation from the one-to-one relation. Olofsson et al. (2009) data are based on c2d spectra and do not contain errors. |
| In the text | |
|
Fig. 2 Emitting region of the 10 μm continuum emission and the strongest water lines contributing to the 15.17 μm, 17.22 μm, and 29.85 μm blends for our typical T Tauri disk model. The emitting regions include 15–85% of the radial and vertical integrated flux at the given wavelengths. The green dashed line marks the optical extinction level AV = 1 mag. The white dashed line marks the Tgas = 600 K contour. |
| In the text | |
|
Fig. 3 Representative ratio of water blend to continuum (15.17 μm) versus the 10 μm silicate feature for four series of models. The blue dot models have a different dust size power law distribution index. The green diamond models have a different maximum dust size. The red square models have a different gas mass. The cyan triangle models have a different dust-to-gas ratio. Extreme values for each series are labeled. The shift in the plot produced by models with different Lstar is shown by the black arrow. The yellow shading is the region where the 10 μm features are in absorption and the peak fluxes become negative. The gold star indicates the standard disk model with the DIANA opacity function, and the silver star the model with the fully crystalline dust opacity function. The cyan hexagon indicates the model with the parametrized settling prescription. |
| In the text | |
|
Fig. 4 Water blend fluxes (top 15.17 μm, middle 17.22 μm, bottom 29.85 μm) divided by the local continuum flux versus 10 μm silicate feature peak strength. Diamonds are targets with crystalline dust features (F11.3/F9.8>0.71), crosses are for the amorphous grains. The color coding is based on the ratio F30/F13 reported in Oliveira et al. (2010). Magenta objects are flat disks (ratio below 1.5), cyan are flared objects, yellow are cold disks and brown are edge-on targets (ratio above 15). Black targets are the ones for which this ratio is not available. Arrows indicates upper limit measurements. The shaded pink boxes encircle the area covered in all of our models. |
| In the text | |
Current usage metrics show cumulative count of Article Views (full-text article views including HTML views, PDF and ePub downloads, according to the available data) and Abstracts Views on Vision4Press platform.
Data correspond to usage on the plateform after 2015. The current usage metrics is available 48-96 hours after online publication and is updated daily on week days.
Initial download of the metrics may take a while.