Fig. 3
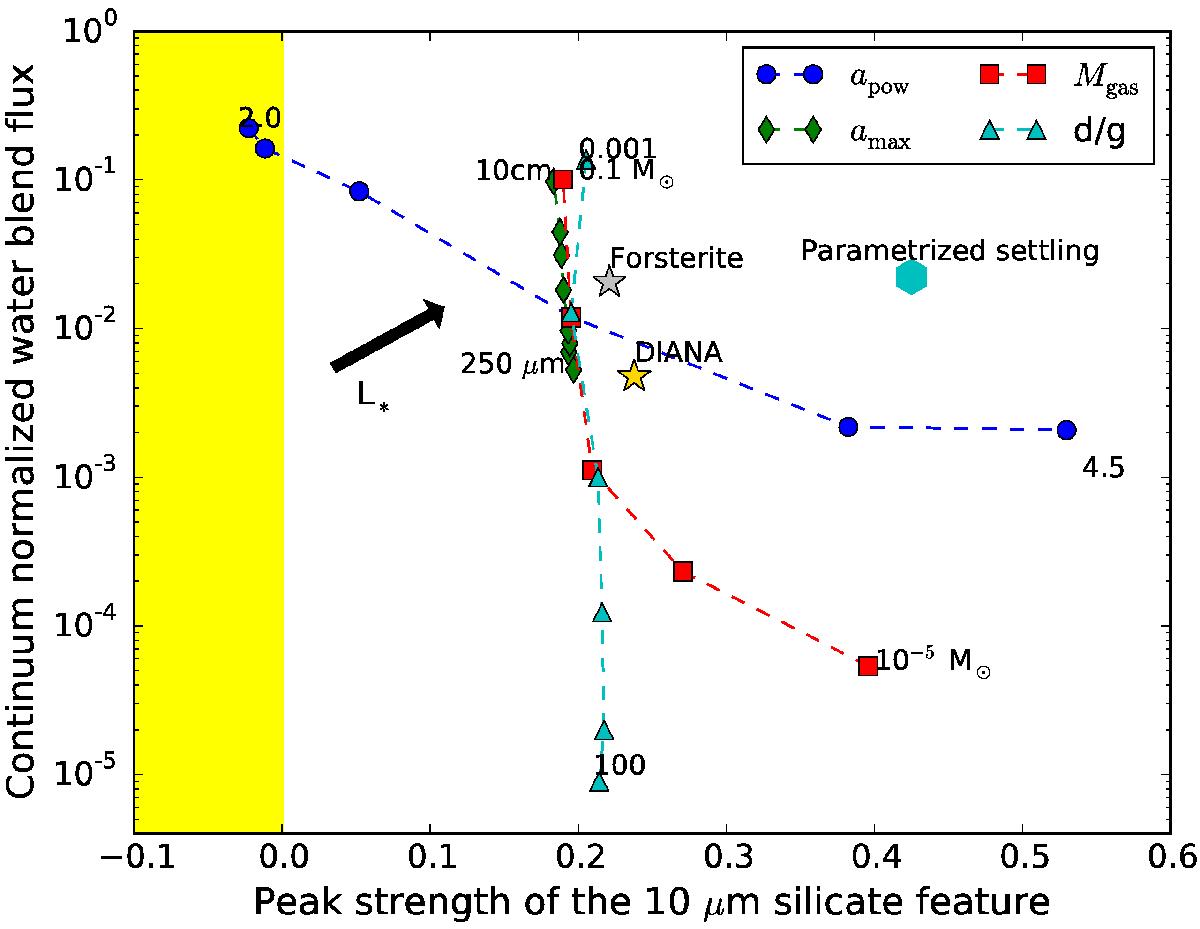
Representative ratio of water blend to continuum (15.17 μm) versus the 10 μm silicate feature for four series of models. The blue dot models have a different dust size power law distribution index. The green diamond models have a different maximum dust size. The red square models have a different gas mass. The cyan triangle models have a different dust-to-gas ratio. Extreme values for each series are labeled. The shift in the plot produced by models with different Lstar is shown by the black arrow. The yellow shading is the region where the 10 μm features are in absorption and the peak fluxes become negative. The gold star indicates the standard disk model with the DIANA opacity function, and the silver star the model with the fully crystalline dust opacity function. The cyan hexagon indicates the model with the parametrized settling prescription.
Current usage metrics show cumulative count of Article Views (full-text article views including HTML views, PDF and ePub downloads, according to the available data) and Abstracts Views on Vision4Press platform.
Data correspond to usage on the plateform after 2015. The current usage metrics is available 48-96 hours after online publication and is updated daily on week days.
Initial download of the metrics may take a while.