| Issue |
A&A
Volume 596, December 2016
|
|
|---|---|---|
| Article Number | A64 | |
| Number of page(s) | 10 | |
| Section | Extragalactic astronomy | |
| DOI | https://doi.org/10.1051/0004-6361/201629310 | |
| Published online | 01 December 2016 | |
Do some AGN lack X-ray emission?⋆
1 Instituto de Astrofísica and Centro de Astroingeniería, Facultad de Física, Pontificia Universidad Católica de Chile, Casilla 306, Santiago 22, Chile
e-mail: This email address is being protected from spambots. You need JavaScript enabled to view it.
2 Millennium Institute of Astrophysics (MAS), Nuncio Monseñor Sótero Sanz 100, Providencia, Santiago, Chile
3 Space Science Institute, 4750 Walnut Street, Suite 205, Boulder, Colorado 80301, USA
4 Astronomy Department, University of Virginia, PO Box 400325, Charlottesville, VA 22904-4325, USA
5 Main Astronomical Observatory, Ukrainian National Academy of Sciences, 27 Zabolotnoho Street, Kyiv 03680, Ukraine
6 Jet Propulsion Laboratory, California Institute of Technology, Pasadena, CA 91109, USA
7 Cahill Center for Astronomy and Astrophysics, California Institute of Technology, Pasadena, CA 91125, USA
Received: 13 July 2016
Accepted: 23 September 2016
Abstract
Context. Intermediate-mass black holes (IMBHs) are thought to be the seeds of early supermassive black holes (SMBHs). While ≳100 IMBH and small SMBH candidates have been identified in recent years, few have been robustly confirmed to date, leaving their number density in considerable doubt. Placing firmer constraints both on the methods used to identify and confirm IMBHs/SMBHs, as well as characterizing the range of host environments that IMBHs/SMBHs likely inhabit is therefore of considerable interest and importance. Additionally, finding significant numbers of IMBHs in metal-poor systems would be particularly intriguing, since such systems may represent local analogs of primordial galaxies, and therefore could provide clues of early accretion processes.
Aims. Here we study in detail several candidate active galactic nuclei (AGN) found in metal-poor hosts.
Methods. We utilize new X-ray and optical observations to characterize these metal-poor AGN candidates and compare them against known AGN luminosity relations and well-characterized IMBH/SMBH samples.
Results. Despite having clear broad optical emission lines that are long-lived (≳10−13 yr), these candidate AGN appear to lack associated strong X-ray and hard UV emission, lying at least 1−2 dex off the known AGN correlations. If they are IMBHs/SMBHs, our constraints imply that they either are not actively accreting, their accretion disks are fully obscured along our line-of-sight, or their accretion disks are not producing characteristic high energy emission. Alternatively, if they are not AGN, then their luminous broad emission lines imply production by extreme stellar processes. The latter would have profound implications on the applicability of broad lines for mass estimates of massive black holes.
Key words: galaxies: active / galaxies: Seyfert / X-rays: galaxies / galaxies: dwarf
The reduced spectra (FITS files) are only available at the CDS via anonymous ftp to cdsarc.u-strasbg.fr (130.79.128.5) or via http://cdsarc.u-strasbg.fr/viz-bin/qcat?J/A+A/596/A64
© ESO, 2016
1. Introduction
Active galactic nuclei (AGN) are usually found in massive, bulge-dominated galaxies that have already converted most of their gas into stars by the present epoch, and consequently tend to have high metallicities. Observations of AGN have borne this out, showing that AGN hosts usually possess metallicities ranging from solar to supersolar (e.g., Storchi-Bergmann et al. 1998; Hamann et al. 2002). This raises the question as to whether low-metallicity AGN exist, and if so, in what types of galaxies? We can glean some insight from the black hole (BH) mass to bulge luminosity relation (Kormendy & Richstone 1995; Magorrian et al. 1998; Bentz et al. 2009) and the BH mass to bulge velocity dispersion relation (MBH−σ; Haehnelt & Kauffmann 2000; Gebhardt et al. 2000; Ferrarese & Merritt 2000; Tremaine et al. 2002; Greene & Ho 2006), both of which relate BH mass to galaxy growth. These relations have largely been established only in nearby massive galaxies (with MBH ~ 106−1010M⊙; e.g., McConnell & Ma 2013), where a BH’s gravitational influence can be resolved and studied, but we expect that they should extend to higher and lower galaxy mass regimes.
Although there is still much debate about how these relations behave in the low-mass regime (e.g., Barth et al. 2005; Greene et al. 2010; Jiang et al. 2011; Graham & Scott 2013; Sartori et al. 2015), these relations naively imply that intermediate-mass BHs (IMBHs), which are thought to be the missing link between stellar-mass and supermassive BHs (SMBHs) and potential seeds of SMBHs in the early universe (e.g., Volonteri 2012), should occur in low-mass dwarf galaxies. The discovery and characterization of IMBHs are thus of particular interest.
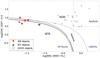 |
Fig. 1 [Oiii]/Hβ against [Nii]/Hα narrow line emission ratios. Vertical and horizontal dotted lines mark the boundaries of the three main classes of emission line nuclei from Ho et al. (1997). The dashed curve shows the demarcation between starburst galaxies and AGNs defined by Kewley et al. (2001). The solid black curve shows the demarcation between star-forming Hii regions and starburst galaxies from Kauffmann et al. (2003), while the solid red, blue and green curves denote the AGN-Hii separation from Kewley et al. (2013), corrected to redshifts of z = 0.1, 0.2 and 0.3, respectively. Filled red and green triangles represent the I08 and I07 objects, respectively. Open circles represent the GH04 objects. The I08 and I07 galaxies lie on the left side near the boundary separating AGN from star-forming regions. Their location is consistent with the stellar origin, but non-thermal radiation is not excluded. It is important to note that metal-poor AGN will have weaker [Nii] and [Oiii] emission, such that they migrate from the right side of the diagram to the left (e.g., Groves et al. 2006), making the standard diagnostic more ambiguous. Thus, the origin of the ionising process cannot be determined by this diagram alone. |
The most robust way to confirm the presence of a BH is via spatially resolved dynamical estimates. However, this method is difficult to employ in practice due to the small regions of influence around IMBHs. Thus it is often necessary to resort to indirect estimates. One method is to search for the telltale signs of broad-line emission associated with AGN activity due to photoionized gas within the gravitational influence of the BH. Greene & Ho (2004, 2006, 2007), Izotov et al. (2007, hereafter I07), Reines et al. (2013) and others, for instance, have used the SDSS spectroscopic archives to systematically search for such broad-line tracers, finding 10’s to 100’s of candidates. A second method is to use diagnostic line ratios that assess the underlying UV spectrum to separate out AGN activity from star formation and shocks (e.g., Groves et al. 2006; Reines et al. 2013; Moran et al. 2014). Finally, a third method is to search for X-ray, mid-IR, and/or compact, low-luminosity radio emission, which can sometimes be interpreted as unambiguous signs of AGN activity (e.g., Greene & Ho 2006; Reines et al. 2014; Hainline et al. 2016); notably, 70% of the Greene & Ho (2004, hereafter GH04) sample have clear X-ray emission, strengthening their identification (Desroches et al. 2009, hereafter D09). Despite the discovery of numerous AGN candidates in dwarf galaxies with these methods, few IMBHs with masses below 105M⊙ have been conclusively identified (e.g., NGC 4395, RGG118 and HLX-1) and few AGN overall have been found in metal-poor (Z< 0.2 Z⊙) systems which might be considered analogs of early AGN hosts (Groves et al. 2006).
In this work, we study several metal-poor systems which have been argued to host candidate AGN based on luminous, constant, broad emission lines. We place new constraints on these objects using X-ray observations from the Chandra Observatory and additional ground-based optical spectroscopy. The outline of the paper is as follows. In Sect. 2, we describe the X-ray and optical observations and data reduction procedures. In Sect. 3, we present the results and compare these to other known AGN, as well as possible alternative interpretations. In Sect. 4, we summarize our work and discuss broader implications.
General properties of sample.
2. Data
2.1. Sample
While searching for low-metallicity dwarf galaxies in the Sloan Digital Sky Survey (SDSS, DR5), I07 discovered a subset of 21 emission-line galaxies (ELGs) which have broad Hα emission suggesting potential AGN activity. From these, Izotov & Thuan (2008, hereafter I08) singled out four of the most extreme metal-poor (Z = 0.05−0.16 Z⊙) sources as having the strongest evidence for hosting candidate AGN based on their very unusual spectral properties.
We targeted with dedicated Chandra observations the four most extreme ELGs reported by I08 (J1025+1402, J1047+0739, J0045+1339, and J1222+3602). For completeness, we also report the results of archival Chandra observations for three weaker objects (J1536+3122, J0840+4707, and J1404+5423) in the parent I07 sample which also have broad Hα emission lines. Table 1 presents the names and coordinates of all seven metal-poor ELGs.
The four I08 ELGs all have strong, broad permitted Hαλ6563 lines (full width at half maximum (FWHM) ≈ 1600−1900 km s-1, full width at zero intensity (FWZI) ≈ 2200−3500 km s-1) with luminosities LHα,br = 3 × 1041−2 × 1042 erg s-1 which persist with little variability over periods of at least ~3−7 years (I08). Such lines are far too broad, luminous, and constant to be attributed to stellar processes such as Wolf-Rayet stars, Ofp or luminous blue variable star winds, single or multiple supernova (SN) remnants, giant SN bubbles, or even shocks propagating in dense circumstellar envelopes around Type IIn SNe. Standard stellar mechanisms can typically only account for LHα,br ~ 1036−1040 erg s-1 (e.g., Kennicutt et al. 1989; Gunawardhana et al. 2013), while the I08 objects are 30 to 200 times more luminous. Type IIn SNe can potentially generate LHα,br ~ 1038−1042 erg s-1, but only for a few years in the most extreme cases (e.g., SN 2005ip and SN 2006jd; Stritzinger et al. 2012) and generally have notable variability (see Sect. 3). This leaves only an AGN origin, although extremely luminous and long-lived SNe cannot be completely ruled out. For the three weaker I07 objects (FWHM ≈ 1300−1500 km s-1, FWZI ≈ 3300−6700 km s-1 with luminosities LHα,br = 2 × 1038−9 × 1040 erg s-1), the situation is more ambiguous, since all mechanisms, stellar and non-stellar, remain viable.
All of the objects closely follow the AGN relations which relate L5100 Å to both LHα,br and L[OIII] (e.g., Greene & Ho 2005, hereafter GH05). However, this only implies that the observed UV/optical continuum is sufficient to power the Hα and [Oiii] emission and does not necessarily indicate what the emission mechanism is (e.g., AGN accretion). If we look at the AGN/star formation emission-line diagnostic diagram (e.g., Kewley et al. 2013) based on the [Nii]/Hα and [Oiii]/Hβ line ratios shown in Fig. 1, we see that all the objects are located on the left side near the boundary separating AGN from star-forming regions. Although their location is consistent with the stellar origin, non-thermal radiation cannot be excluded. It is important to note that low-metallicity galaxies will systematically shift to the left of the Baldwin, Phillips and Telervich diagram (Baldwin et al. 1981), making it difficult to classify metal-poor AGN based on this diagram alone (Groves et al. 2006). Finally, the broad Balmer lines in all seven objects show very steep decrements (≳7), which suggest either that collisional excitation is important and that the broad emission comes from very dense gas (Ne ~ 104 cm3), or alternatively that the broad line region suffers from high extinction and the AGN is a type 1.9. Given that the optical continuum and emission line luminosities are consistent, the latter seems less likely.
I08 estimated BH masses of ~(0.5−3) × 106 M⊙ for their four AGN candidates following the relation derived by GH05 between Hα and MBH. We have similarly estimated BH masses for the three I07 objects using the GH05 relation to be ~(0.4−3) × 105 M⊙, assuming that the broad LHα,br have an AGN origin. See Table 1 for details.
In general, the I08 AGN candidate galaxies are quite compact (marginally resolved, ≈2′′ in extent) and have relatively red optical colors due in part to the presence of several strong emission lines. Galaxies J1025+1402 and J1047+0739 have approximately round shapes, whereas J0045+1339 and J1222+3602 have distorted morphologies suggestive of cometary structure (e.g. Loose & Thuan 1985). The I07 candidates are also relatively compact but have bluer optical colors likely due to their lower redshifts. Galaxies J0840+4707 and J1536+3122 have somewhat extended morphologies (≈2′′× 5′′ in extent). J1404+5423 is actually an individual Hii region found in the host galaxy M101, and not an ELG. The location of this object, ~11′ (~16 kpc) from the M101 nucleus, likely rules out a central massive black hole (hence the “?” in Table 1). Nonetheless, we retain it throughout our analysis since its emission lines share many properties with the more luminous ELGs and may aid interpretation.
2.2. X-ray observations
Based on known relations between broad Hα, [Oiii], and X-ray emission for unobscured AGN (e.g., Panessa et al. 2006, hereafter P06), we expect the I08 AGN candidates to be relatively X-ray bright emitters (e.g., with ~50−300 counts in the 0.5−7.0 keV band expected in 5 ks Chandra exposures). Thus, we initiated a small program to observe the four AGN candidates with the Chandra X-ray Observatory (PI: Thuan) using the ACIS-S CCD camera. For the three weaker AGN, we retrieved Chandra observations from the archive. The processing, screening, and analysis of the data were performed using the standard tools from CIAO (v4.4), as well as custom IDL software. No strong background flares occurred during the observations. We selected only good events (status = 0) between 0.5−7.0 keV for further study. Additional details about the observations are listed in Table 3.
Among the I08 objects, only the most luminous Hα emitter, J1047+0739, is marginally detected, with three photons at energies of 0.9, 0.95 and 2.3 keV, hinting at a soft underlying spectrum which could be ascribed to the X-ray binary population in the host galaxy. For the 27 I07 objects, a search of the archival data yields 3 detections. Given the low number of detected counts, we used the WebPIMMS tool to convert counts into fluxes for each particular observing cycle assuming a power-law spectrum with Γ = 1.8 and Galactic NH, as might be expected for IMBHs. The resulting observed 2−10 keV luminosities (or limits) are provided in Table 3. For count and flux upper limits, we adopt the Bayesian method of Kraft et al. (1991).
2.3. Optical spectroscopy
Archival SDSS optical spectroscopy of our targets was previously examined in detail in I07 and I08. Subsequent observations have been acquired on a number of occasions and instruments to investigate variability as follows.
Multi-epoch broad Hα fluxes for AGN candidates.
New optical spectra for galaxies J0045+1339, J1025+1402, J1047+0739, and J1222+3602 were obtained using the Apache Point Observatory (APO) 3.5 m telescope using the Dual Imaging Spectrograph (DIS) in both the blue and red wavelength ranges. The sources were observed on several occasions between 2007−2015 as indicated in Table 2, generally under non-photometric conditions and seeing between ~1−3′′. Slit widths of 0.9−2′′ were used. In the blue range, we used the B400 grating, with a linear dispersion of 1.83 Å pixel-1 and a central wavelength of 4400 Å, while in the red range we used the R300 grating with a linear dispersion of 2.31 Å pixel-1 and a central wavelength of 7500 Å. Spectrophotometric standard stars Feige 34, Feige 110, and G191B2B were observed for flux calibration (Massey & Gronwall 1990). The data reduction procedures are the same as described in Thuan & Izotov (2005).
New optical spectra for galaxies J0045+1339 and J1222+3602 were obtained using the MODS instrument on the Large Binocular Telescope (LBT) on UT 2013 October 27 and UT 2015 May 18, respectively (Fig. A.1). Slit widths of 1′′ were used. The G400L grating in the blue range yields a linear dispersion of 0.278 Å pixel-1 and a central wavelength of 4000 Å, while the G670L grating in the red range delivers a linear dispersion of 0.173 Å pixel-1 and a central wavelength of 8000 Å. Spectrophotometric standard stars Feige 34 and Feige 110 were observed for flux calibration (Massey & Gronwall 1990). For both the data reduction procedures are the same as described in Thuan & Izotov (2005).
New optical spectra for galaxies J1025+1402 and J1047+0739 were obtained using the LRIS instrument on the Keck telescope on UT 2016 February 14 (Fig. A.2). The spectra were observed at the parallactic angle, through 1.5 arcsec slits, with total exposures of 600 s each. The night was photometric, although the seeing was ~1.̋1. A 1.̋5 wide slit was adopted, with the 5600 Å dichroic to split the light, the 600 ℓ mm-1 grism on the blue arm (λblaze = 4000 Å; spectral resolving power R ≡ λ/ Δλ ~ 1100), and the 400 ℓ mm-1 grating on the red arm (λblaze = 8500 Å; R ~ 1000). The spectra were reduced and extracted following standard procedures, and flux-calibrated based on observations of spectrophotometric standard stars G191B2B and HZ44 (Massey & Gronwall 1990).
Line fluxes were estimated through spectral decomposition of the continuum and various emission lines. Critically, the spectra show no significant change in the broad Hα emission lines compared to past epochs. The errors reported in Table 2 are statistical only and do not account for additional systematic errors, which could be as large as ~50% given that many of the above observations were taken on different instruments, generally in non-photometric conditions, and with varying slit widths.
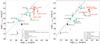 |
Fig. 2 Hard X-ray (2–10 keV) emission compared to broad Hα emission (left) and [Oiii] emission (right). The I08 and I07 objects are denoted by red and green filled triangles, respectively. The best-fit regressions for AGN from P06 are shown as solid black lines, while the individual AGN used by P06 are shown as open black circles. The dotted line shows the hard X-ray (2–10 keV) – star formation rate relation presented by Ranalli et al. (2003) and Kennicutt (1998). Additional objects from GH04 and the literature are denoted by filled blue circles and filled grey triangles, respectively. Downward arrows denote X-ray upper limits for all samples. |
X-ray properties of AGN candidates.
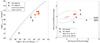 |
Fig. 3 (Left) Rest-frame 2–10 keV X-ray and 6 μm luminosities for the I08 and I07 objects, calculated following the method described in Stern (2015). The dashed line indicates the best linear fit for AGN from Lutz et al. (2004), while the solid curve shows the AGN relation, corrected for high and low luminosities, from Stern (2015). (Right) Color–color diagram using the three most sensitive WISE bands 3.4 μm (W1), 4.6 μm (W2) and 12 μm (W3). The dashed line shows the demarcation between star-forming galaxies and AGN from Stern et al. (2012). The gray ellipse represents the region where most SDSS detected QSOs lie (Izotov et al. 2014). In both plots: the filled red and green triangles represent the I08 and I07 objects, respectively; downward arrows denote X-ray upper limits; and all objects are strongly detected by WISE such that their errors are smaller than the symbols representing them. |
3. Discussion
We now investigate hard X-ray (2−10 keV) constraints for the four I08 low-metallicity AGN candidates and the three Chandra observed galaxies from the I07 sample. Figure 2 compares the hard X-ray luminosity against the Hα and [Oiii] luminosities for these objects, allowing us to examine how they lie compared to the AGN and star-forming relations of P06 and Ranalli et al. (2003), respectively. We also show in Fig. 2 X-ray constraints for the P06 AGN, the GH04/D09 candidate IMBHs/SMBHs, and five additional objects: RGG 118, Pox 52, NGC 4395, Henize 2−10 and Mrk 709 (south). These last five dwarf galaxies are reported to host BHs of ~104−107M⊙ (RGG 118 – Baldassare et al. 2015; Pox 52 – Barth et al. 2004; NGC 4395 – Filippenko & Ho 2003; Henize 2−10 – Reines & Deller 2012; Whalen et al. 2015; Mrk 709 – Reines et al. 2014) and thus provide useful comparisons for our investigation. The BH in RGG 118 is the smallest ever reported in a galaxy nucleus, while Pox 52 and NGC 4395 are of particular interest since their BH masses (~105M⊙) are better constrained; all lie in the IMBH regime. Pox 52 and NGC 4395 have similar properties and are classified as dwarf Seyfert 1 galaxies. It is noteworthy that NGC 4395 has no discernible bulge, and thus is not expected to host a central BH, but its nucleus exhibits all the characteristics of Seyfert activity, including broad emission lines and X-ray variability.
The P06 AGN, GH04/D09 candidate IMBHs/SMBHs, and the five additional objects more or less all follow the expected AGN correlations, which represent various known couplings (e.g., broad and narrow line regions, X-ray corona) with the accretion disk. The only outlier appears to be the strong [Oiii] emission from Mrk 709 (south), pushing it ~2 dex off the AGN relation of P06. This offset could be an X-ray deficit due to X-ray variability or obscuration, or an [Oiii] excess related to stronger AGN emission in the past. In general, the highest X-ray luminosity is shown in Fig. 2, but X-ray variability still presumably contributes substantially to the dispersion in the P06 relations. Also shown are the I08 objects, denoted by downward arrows for X-ray upper limits and a red solid triangle. These categorically demonstrate a lack of X-rays for a given strength of broad Hα and [Oiii] emission. As a sample, this is unusual and atypical of AGN.
If the X-ray deficit is due to variability, we would expect the objects under study here to scatter around the P06 relation, which they do not. Another explanation could be strong line-of-sight obscuration (NH ≳ 1024 cm-2), with the caveat that the few photons that are detected in J1047+0739 are low-energy ones. However, assuming this geometry for all four I08 objects and a standard AGN orientation paradigm might imply a large population of unobscured AGN in dwarf galaxies that is not currently observed. A third possibility is that these objects are intrinsically X-ray weak, whereby the characteristic strong X-ray emitting corona is never produced. This odd behavior has been observed in a few Broad Absorption Line (BAL) quasars and luminous infrared galaxies (e.g., Luo et al. 2014; Teng et al. 2015), although the I08 objects ought to occupy a very different physical regime. Given the lack of understanding in these objects, this possibility remains difficult to exclude, however.
We further investigate the nature of the X-ray deficit by examining the mid-infrared (MIR) emission for the sample, benefiting from the Wide-field Infrared Survey Explorer (WISE), which imaged the entire sky in four bands centered at 3.4, 4.6, 12 and 22 μm, called W1, W2, W3 and W4, respectively. If these I08 and I07 objects are highly obscured AGN (e.g., a large fraction of the accretion disk emission is blocked by a dusty torus), we may see their re-radiated emission at MIR wavelengths (e.g., Efstathiou & Rowan-Robinson 1995), since this hot dust emission is largely unaffected by further obscuration from the torus or interstellar medium. AGN are often revealed either by their characteristic X-ray-to-MIR ratios (Lutz et al. 2004; Gandhi et al. 2009; Asmus et al. 2015; Stern 2015) or red MIR colors (e.g., Richards et al. 2006; Assef et al. 2010). The X-ray-to-MIR ratio is well suited for detecting obscured AGN, since the X-ray emission is expected to be suppressed compared to the MIR emission (e.g., Alexander et al. 2008; Lanzuisi et al. 2009; Bauer et al. 2010). Likewise, Stern et al. (2012) found that a cut at W1−W2 ≥ 0.8 mag provides a very reliable AGN indicator of hot dust in both obscured and unobscured sources with W2 < 15.05 mag, based on a WISE-selected sample of AGN.
Figure 3 shows the mentioned relations for the I08 and I07 objects from Table 3, represented by red and green triangles, respectively, with upper limits denoted by downward arrows. On the left side, we compare the rest-frame hard 2−10 keV X-ray and 6 μm luminosities of the objects against the standard relations from Lutz et al. (2004) and Stern (2015). Notably, all the galaxies lie below the AGN relations, most by factors of at least ~10−60 (three sources have only X-ray upper limits and could be substantially lower still). This is consistent with our previous findings of X-ray deficits. On the right side, we show the observed MIR colors W1−W2 and W2−W3 for the I08 and I07 objects, where the dashed line denotes the W1−W2 ≥ 0.8 mag limit from Stern et al. (2012). Five objects lie above the line, suggesting an AGN classification. Critically, however, Izotov et al. (2014) examined the MIR colors of ~10 000 star-forming galaxies with strong emission lines and no obvious signs of AGN, detected in both SDSS and WISE, and found that a non-negligible number (~5%) scattered above the fiducial AGN criterion of Stern et al. (2012), although they remained distinctly offset in W2−W3 from QSOs (e.g., Fig. 7c of Izotov et al. 2014). Izotov et al. (2014) found that these objects are mainly luminous galaxies with high-excitation Hii regions, and their unusual WISE colors are produced by hot dust associated with radiation from young star-forming regions. Meaning that the I08 and I07 objects could belong to this tail of the star-forming galaxy population. Thus, some objects exhibit MIR properties consistent with highly obscured AGN activity, but we lack conclusive results that can differentiate AGN from star-forming regions for our samples.
Notably, most of the I08 objects have strong limits on high-ionization emission lines like Heii and [Ne v], implying that there is also no strong non-thermal hard ionizing UV radiation present. The exception is J1222+3602, which has a [Ne v]/Heii ratio of ~1.5. This is ~5 times higher than in star-forming galaxies and is more consistent with the value for Seyfert 2 galaxies. In general, this is consistent with the observed deficit of X-ray emission, and implies that the BHs in the I08 objects may not be strongly accreting at all, or as I08 argued, that there is a high covering factor from the accretion disk itself that absorbs the hard UV (and now X-ray) emission. One final interesting scenario is for the circumnuclear gas to be influenced by the gravitational potential of a dormant IMBH/SMBH but excited by stellar processes. Strong narrow emission lines are present in all I08 objects, implying that stellar processes are able to generate sufficient photon or shock excitation. It could be possible that these processes are energetic enough to power the broad line excitation too. In this scenario, most of the ionizing stars or shocks would presumably need to reside close to the broad line gas in order to satisfy the observed UV continuum constraints. This seems like a physically implausible scenario.
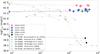 |
Fig. 4 Time evolution of the broad Hα luminosity for the I08 objects, as well as several luminous type IIn SNe (Kuncarayakti et al. 2016; Aretxaga et al. 1999; Stritzinger et al. 2012; Smith et al. 2008; Jencson et al. 2016) and the transient event SDSS1133 (Koss et al. 2014). The I08 objects are roughly constant over periods of 10−13 yr; there is some variability between epochs at the ~50% level, but this could be due to calibration uncertainties. All error bars are smaller than the symbols. |
One of the mechanisms proposed by I08 to explain the observed offset in broad Hα is the presence of type IIn SNe, since this type of SNe can produce relatively long-lived, high broad Hα luminosities. Figure 4 shows the time evolution for several luminous type IIn SNe compared to the I08 objects. The I08 objects show no significant variation in broad Hα emission at least over periods of ~10−13 years. While a few individual SNe have been observed to have broad Hα luminosities as high as the I08 objects (e.g., SN 2005ip and SN 2006jd; Stritzinger et al. 2012), Fig. 4 shows that such powerful SNe can only generate such luminosities for ≲3 yr. SN 1978K stands out for having a broad Hα luminosity that has shown little variation over the course of ~25 years; however, its luminosity is 2−3 dex less than those of the I08 objects. Thus, the I08 objects would require large numbers of such SNe to maintain the bright, roughly constant broad Hα luminosities that are observed. Because such SNe are thought to be produced by high mass stars, this scenario seems unlikely based on the star formation rates, initial mass function, and general lack of transients observed in such dwarfs.
Koss et al. (2014) reported on an unusually persistent transient, SDSS J113323.97+550415.8 (hereafter SDSS1133), in the nearby blue compact dwarf galaxy Mrk 177, which shares some similarities with the I08 objects. Unlike the I08 objects, the transient lies 5.̋8 away from the apparent nucleus (a projected offset of 0.8 kpc) and has slowly varying broad Balmer line emission with a velocity offset of ~200−800 km s-1 from the host nucleus and a peak luminosity of ~ 1040 erg s-1. Such properties imply that SDSS1133 could be a black hole recoil candidate, although some traits can also be explained by a luminous blue variable star that was erupting for decades before exploding as a type IIn SN. With respect to the latter, Koss et al. argue that this event would represent one of the most extreme episodes of pre-SN mass-loss ever discovered. Mrk 177 shows signs of clumpy star formation, analogous to the extended emission observed for two I08 galaxies. The emission lines from the Mrk 177 host nucleus (Z ≈ Z⊙) and SDSS1133 generally place both in the star-forming galaxy region of the diagnostics plots, although at its centroid SDSS1133 shifts somewhat into the Seyfert galaxy regime. SDSS1133 also shows 1−3 mag of optical variability on timescales of ~1−60 years, unlike the I08 objects. It is interesting to consider that if SDSS1133 were coincident with the nucleus, it would be more strongly contaminated by the nuclear star formation and vary less, and therefore be even more comparable to the I08 objects. Intriguingly, SDSS1133 is marginally detected by Swift XRT with 7.6 ± 3.4 background-subtracted 0.3−10 keV counts, corresponding to a 0.3−10 keV luminosity of 1.5 × 1039 erg s-1 (adopting a power-law spectrum with fixed Γ = 1.9). With this limited amount of X-ray emission, Koss et al. cannot distinguish between the AGN and SN scenarios, similar to the case of J1047+0739. The broad Hα (from 2003) and X-ray (from 2013) luminosities of SDSS1133 place it ~1.5 dex off the P06 AGN relation, similar to the I08 objects, although these were not taken contemporaneously and the X-ray emission could have been significantly higher 10 years beforehand.
4. Summary
We have studied the X-ray, Hα, and [O iii] emission properties from a sample of low-metallicity compact dwarf galaxies discovered by SDSS to have unusually broad and luminous Hα emission.
-
1.
Given the strength of the broad Hα and total [O iii] emission, if they were produced by an accretion disk surrounding an IMBH/SMBH, we would expect to detect significant X-ray emission for all the I07 and I08 objects. However, surprisingly, only one of the four I08 objects – J1047+0739 – has a (marginal) X-ray detection, where we find three soft (0.9−2.3 keV) photons in 4782 s. The latter can be explained as soft emission produced by the X-ray binary population in the host galaxy. Regarding the I07 objects, we found 3 Chandra detections in the archives. For these, a pure stellar origin of the broad Hα luminosities cannot be ruled out.
-
2.
Our X-ray limits constrain the I07 and I08 objects to lie at least ~1−2 dex below the known AGN relations. These limits are consistent with the apparent lack of any strong non-thermal hard ionizing UV radiation suggested by the weak high-ionization emission lines. Together, the X-ray and UV constraints imply that no strong accretion onto IMBH/SMBHs is present in these objects, or that alternatively it is completely obscured along our line of sight.
-
3.
Continued spectral monitoring of the broad Hα emission lines in the I08 objects demonstrates that their broad lines have remained approximately constant for at least ~10−13 years. The production of such long-lived, high luminosity broad lines is strongly incompatible with individual known SNe, and would require many 10s to 100s of such SNe in order to sustain their luminosity and lack of strong variability. This scenario seems unlikely based on the host galaxy properties and low number of transients observed in similar compact dwarfs to date.
While the I07 objects conform in many ways to the characteristics of star-forming galaxies, the I08 objects have a number of intriguing properties which are non-trivial to explain. If these objects are in fact AGN as proposed originally, they imply that X-ray and UV weak AGN exist. It is unclear how the AGN relations might behave in the low BH mass, low-metallicity regime, and confirmation of BHs in these objects could thus provide possible insights on AGN activity in metal-poor dwarf galaxies. On the other hand, if these objects are not AGN, then their nature is uncertain and perplexing to explain in the context of current empirical and theoretical properties of star formation and SNe, and would likely require extreme events or processes that are as yet unknown. More generally, if such broad lines can be produced via stellar processes, the I08 objects highlight a clear flaw in identifying and characterizing lower mass AGN based on their broad optical emission lines. This would leave many of the BH mass estimates made over the past decade on shaky ground. In this sense, the I08 objects remain highly intriguing laboratories for future study.
The favored explanation – AGN – cannot be firmly confirmed or discarded at this point, and more data are necessary to understand the underlying phenomenon in these galaxies. In particular, focused studies of the most extreme I08 objects at X-ray, optical, and radio wavelengths will help to understand whether they can still be accommodated under the AGN paradigm; VLA and EVN observations are currently being analyzed (N. Guseva et al., in prep.). Longer X-ray exposures of J1047+0739 will characterize better its X-ray spectral and temporal nature. High spatial resolution imaging and spectroscopy can place better constraints on the spatial extent of the broad emission lines and determine what fraction might be attributable to stellar processes. And finally, Very Long Baseline Array observations can help pinpoint the location and properties of any non-thermal sources buried in the centers of these compact galaxies. These studies would help to address how robust optical broad lines are as tracers of AGN activity, a robustness that has been called into question by our current constraints on the I08 objects.
Acknowledgments
We thank Mislav Balokovic for help acquiring Keck spectra. The work of Daniel Stern was carried out at the Jet Propulsion Laboratory, California Institute of Technology, under a contract with NASA. We acknowledge support from CONICYT-Chile grants Basal-CATA PFB-06/2007 (FEB), FONDECYT Regular 1141218 (CS, FEB), and “EMBIGGEN” Anillo ACT1101 (FEB); the Ministry of Economy, Development, and Tourism’s Millennium Science Initiative through grant IC120009, awarded to The Millennium Institute of Astrophysics, MAS (FEB); and NASA through Chandra Award Number GO9-0106C (FEB, TXT) issued by the Chandra X-ray Observatory Center, which is operated by the Smithsonian Astrophysical Observatory for and on behalf of the NASA under contract NAS8-03060. The scientific results reported in this article are based in part on observations made by the Chandra X-ray Observatory and data obtained from the Chandra Data Archive, as well as observations made by the Chandra X-ray Observatory and published previously in cited articles. This research has made use of software provided by the Chandra X-ray Center (CXC) in the application packages CIAO, ChIPS, and Sherpa. This publication makes use of data products from the Wide-field Infrared Survey Explorer, which is a joint project of the University of California, Los Angeles, and the Jet Propulsion Laboratory/California Institute of Technology, funded by the National Aeronautics and Space Administration. Data presented herein were obtained at the W. M. Keck Observatory, which is operated as a scientific partnership among the California Institute of Technology, the University of California and the National Aeronautics and Space Administration. The Observatory was made possible by the generous financial support of the W. M. Keck Foundation. The authors wish to recognize and acknowledge the very significant cultural role and reverence that the summit of Mauna Kea has always had within the indigenous Hawaiian community. We are most fortunate to have the opportunity to conduct observations from this mountain. This paper used data obtained with the MODS spectrographs built with funding from NSF grant AST-9987045 and the NSF Telescope System Instrumentation Program (TSIP), with additional funds from the Ohio Board of Regents and the Ohio State University Office of Research. This research has made use of NASA’s Astrophysics Data System.
References
- Alexander, D. M., Chary, R.-R., Pope, A., et al. 2008, ApJ, 687, 835 [NASA ADS] [CrossRef] [Google Scholar]
- Aretxaga, I., Benetti, S., Terlevich, R. J., et al. 1999, MNRAS, 309, 343 [NASA ADS] [CrossRef] [Google Scholar]
- Asmus, D., Gandhi, P., Hönig, S. F., Smette, A., & Duschl, W. J. 2015, MNRAS, 454, 766 [NASA ADS] [CrossRef] [Google Scholar]
- Assef, R. J., Kochanek, C. S., Brodwin, M., et al. 2010, ApJ, 713, 970 [NASA ADS] [CrossRef] [Google Scholar]
- Baldassare, V. F., Reines, A. E., Gallo, E., & Greene, J. E. 2015, ApJ, 809, L14 [NASA ADS] [CrossRef] [Google Scholar]
- Baldwin, J. A., Phillips, M. M., & Terlevich, R. 1981, PASP, 93, 5 [NASA ADS] [CrossRef] [EDP Sciences] [Google Scholar]
- Barth, A. J., Ho, L. C., Rutledge, R. E., & Sargent, W. L. W. 2004, ApJ, 607, 90 [NASA ADS] [CrossRef] [Google Scholar]
- Barth, A. J., Greene, J. E., & Ho, L. C. 2005, ApJ, 619, 151 [NASA ADS] [CrossRef] [Google Scholar]
- Bauer, F. E., Yan, L., Sajina, A., & Alexander, D. M. 2010, ApJ, 710, 212 [NASA ADS] [CrossRef] [Google Scholar]
- Bentz, M. C., Peterson, B. M., Pogge, R. W., & Vestergaard, M. 2009, ApJ, 697, 190 [NASA ADS] [Google Scholar]
- Desroches, L., Greene, J. E., & Ho, L. C. 2009, ApJ, 698, 1515 [NASA ADS] [CrossRef] [Google Scholar]
- Efstathiou, A., & Rowan-Robinson, M. 1995, MNRAS, 273, 649 [NASA ADS] [CrossRef] [Google Scholar]
- Ferrarese, L., & Merritt, D. 2000, ApJ, 539, L9 [NASA ADS] [CrossRef] [Google Scholar]
- Filippenko, A. V., & Ho, L. C. 2003, ApJ, 588, L13 [NASA ADS] [CrossRef] [Google Scholar]
- Gandhi, P., Horst, H., Smette, A., et al. 2009, A&A, 502, 457 [NASA ADS] [CrossRef] [EDP Sciences] [Google Scholar]
- Gebhardt, K., Bender, R., Bower, G., et al. 2000, ApJ, 539, L13 [NASA ADS] [CrossRef] [Google Scholar]
- Gehrels, N. 1986, ApJ, 303, 336 [NASA ADS] [CrossRef] [Google Scholar]
- Graham, A. W., & Scott, N. 2013, ApJ, 764, 151 [NASA ADS] [CrossRef] [Google Scholar]
- Greene, J. E., & Ho, L. C. 2004, ApJ, 610, 722 (GH04) [NASA ADS] [CrossRef] [Google Scholar]
- Greene, J. E., & Ho, L. C. 2005, ApJ, 630, 122 (GH05) [NASA ADS] [CrossRef] [Google Scholar]
- Greene, J. E., & Ho, L. C. 2006, ApJ, 636, 56 [NASA ADS] [CrossRef] [Google Scholar]
- Greene, J. E., & Ho, L. C. 2007, ApJ, 656, 84 [NASA ADS] [CrossRef] [Google Scholar]
- Greene, J. E., Peng, C. Y., Kim, M., et al. 2010, ApJ, 721, 26 [NASA ADS] [CrossRef] [Google Scholar]
- Groves, B. A., Heckman, T. M., & Kauffmann, G. 2006, MNRAS, 371, 1559 [NASA ADS] [CrossRef] [Google Scholar]
- Gunawardhana, M. L. P., Hopkins, A. M., Bland-Hawthorn, J., et al. 2013, MNRAS, 433, 2764 [NASA ADS] [CrossRef] [Google Scholar]
- Haehnelt, M. G., & Kauffmann, G. 2000, MNRAS, 318, 35 [Google Scholar]
- Hainline, K., Reines, A., Greene, J., & Stern, D. 2016, ApJ, submitted [Google Scholar]
- Hamann, F., Korista, K. T., Ferland, G. J., Warner, C., & Baldwin, J. 2002, ApJ, 564, 592 [NASA ADS] [CrossRef] [Google Scholar]
- Ho, L. C., Filippenko, A. V., & Sargent, W. L. W. 1997, ApJ, 112, 315 [NASA ADS] [Google Scholar]
- Izotov, Y. I., & Thuan, T. X. 2008, ApJ, 687, 133 (I08) [NASA ADS] [CrossRef] [Google Scholar]
- Izotov, Y. I., Thuan, T. X., & Guseva, N. G. 2007, ApJ, 671, 1297 (I07) [NASA ADS] [CrossRef] [Google Scholar]
- Izotov, Y. I., Guseva, N. G., Fricke, K. J., & Henkel, C. 2014, A&A, 561, A33 [NASA ADS] [CrossRef] [EDP Sciences] [Google Scholar]
- Jencson, J. E., Prieto, J. L., Kochanek, C. S., et al. 2016, MNRAS, 456, 2622 [NASA ADS] [CrossRef] [Google Scholar]
- Jiang, Y., Greene, J. E., & Ho, L. C. 2011, ApJ, 737, 45 [Google Scholar]
- Kalberla, P. M. W., Burton, W. B., Hartmann, D., et al. 2005, A&A, 440, 775 [NASA ADS] [CrossRef] [EDP Sciences] [Google Scholar]
- Kauffmann, G., Heckmann, T. M., Tremonti, C., et al. 2003, MNRAS, 346, 1055 [Google Scholar]
- Kennicutt, R. C. Jr. 1998, ARA&A, 36, 189 [Google Scholar]
- Kennicutt, R. C. Jr., Edgar, B. K., & Hodge, P. W. 1989, ApJ, 337, 761 [NASA ADS] [CrossRef] [Google Scholar]
- Kewley, L. J., Dopita, M. A., Sutherland, R. S., Heisler, C. A., & Travena, J. 2001, ApJ, 556, 121 [Google Scholar]
- Kewley, L. J., Maier, C., Yabe, K., et al. 2013, ApJ, 774, 6 [NASA ADS] [CrossRef] [Google Scholar]
- Kormendy, J., & Richstone, D. 1995, ARA&A, 33, 581 [NASA ADS] [CrossRef] [Google Scholar]
- Koss, M., Blecha, L., Mushotzky, R., et al. 2014, MNRAS, 445, 515 [NASA ADS] [CrossRef] [Google Scholar]
- Kraft, R. P., Burrows, D. N., & Nousek, J. A. 1991, ApJ, 374, 344 [NASA ADS] [CrossRef] [Google Scholar]
- Kuncarayakti, H., Maeda, K., Anderson, J. P., et al. 2016, MNRAS, 458, 2063 [NASA ADS] [CrossRef] [Google Scholar]
- Lanzuisi, G., Piconcelli, E., Fiore, F., et al. 2009, A&A, 498, 67 [NASA ADS] [CrossRef] [EDP Sciences] [Google Scholar]
- Loose, H.-H., & Thuan, T.X. 1985, in Star-forming dwarf galaxies and related objects, eds. D. Kunth, T.X. Thuan, & J.T.T. Van (Gif-sur-Yvette: Éditions Frontières), 73 [Google Scholar]
- Lutz, D., Maiolino, R., Spoon, H. W. W., & Moorwood, A. F. M. 2004, A&A, 418, L465 [NASA ADS] [CrossRef] [EDP Sciences] [Google Scholar]
- Luo, B., Brandt, W. N., Alexander, D. M., et al. 2014, ApJ, 794, 70 [NASA ADS] [CrossRef] [Google Scholar]
- Magorrian, J., Tremaine, S., Richstone, D., et al. 1998, ApJ, 115, 2285 [Google Scholar]
- Massey, P., & Gronwall, C. 1990, ApJ, 358, 344 [NASA ADS] [CrossRef] [Google Scholar]
- McConnell, N. J., & Ma, C.-P. 2013, ApJ, 764, 184 [NASA ADS] [CrossRef] [Google Scholar]
- Moran, E. C., Shahinyan, K., Sugarman, H. R., Vélez, D. O., & Eracleous, M. 2014, ApJ, 148, 136 [Google Scholar]
- Panessa, F., Bassani, L., Cappi, M., et al. 2006, A&A, 455, 173 (P06) [NASA ADS] [CrossRef] [EDP Sciences] [Google Scholar]
- Ranalli, P., Comastri, A., & Setti, G. 2003, A&A, 399, 39 [NASA ADS] [CrossRef] [EDP Sciences] [Google Scholar]
- Reines, A. E., & Deller, A. T. 2012, ApJ, 750, L24 [Google Scholar]
- Reines, A. E., Greene, J. E., & Geha, M. 2013, ApJ, 775, 116 [NASA ADS] [CrossRef] [Google Scholar]
- Reines, A. E., Plotkin, R. M., Russell, T. D., et al. 2014, ApJ, 787, L30 [Google Scholar]
- Richards, G. T., Fan, X., Newberg, H. J., et al. 2002, AJ, 123, 2945 [NASA ADS] [CrossRef] [Google Scholar]
- Sartori, L. F., Schawinski, K., Treister, E., et al. 2015, MNRAS, 454, 3722 [NASA ADS] [CrossRef] [Google Scholar]
- Smith, N., Chornock, R., Li, W., et al. 2008, ApJ, 686, 467 [NASA ADS] [CrossRef] [Google Scholar]
- Stern, D. 2015, ApJ, 807, 129 [NASA ADS] [CrossRef] [Google Scholar]
- Stern, D., Assef, R. J., Benford, D. J., et al. 2012, ApJ, 753, 30 [NASA ADS] [CrossRef] [Google Scholar]
- Storchi-Bergmann, T., Schmitt, H. R., Calzetti, D., & Kinney, A. L. 1998, AJ, 115, 909 [NASA ADS] [CrossRef] [Google Scholar]
- Stritzinger, M., Taddia, F., Fransson, C., et al. 2012, ApJ, 756, 173 [NASA ADS] [CrossRef] [Google Scholar]
- Teng, S. H., Rigby, J. R., Stern, D., et al. 2015, ApJ, 814, 56 [NASA ADS] [CrossRef] [Google Scholar]
- Thuan, T. X., & Izotov, Y. I. 2005, ApJS, 161, 240 [NASA ADS] [CrossRef] [Google Scholar]
- Tremaine, S., Gebhardt, K., Bender, R., et al. 2002, ApJ, 574, 740 [NASA ADS] [CrossRef] [Google Scholar]
- Volonteri, M. 2012, Science, 337, 544 [NASA ADS] [CrossRef] [Google Scholar]
- Whalen, T. J., Hickox, R. C., Reines, A. E., et al. 2015, ApJ, 806, 37 [NASA ADS] [CrossRef] [Google Scholar]
Appendix A: Optical spectra
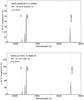 |
Fig. A.1 Optical spectra for galaxies J0045+1339 and J1222+3602 obtained using the LBT telescope on UT 2013 October 27 and UT 2015 May 18, respectively. The broad Hα flux does not present considerable variations compared to previous measurements. |
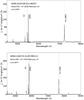 |
Fig. A.2 Optical spectra for galaxies J1025+1402 and J1047+0739 obtained using the LRIS instrument on the Keck telescope on UT 2016 February 14. The broad Hα flux does not present considerable variations compared to previous measurements. |
All Tables
All Figures
|
Fig. 1 [Oiii]/Hβ against [Nii]/Hα narrow line emission ratios. Vertical and horizontal dotted lines mark the boundaries of the three main classes of emission line nuclei from Ho et al. (1997). The dashed curve shows the demarcation between starburst galaxies and AGNs defined by Kewley et al. (2001). The solid black curve shows the demarcation between star-forming Hii regions and starburst galaxies from Kauffmann et al. (2003), while the solid red, blue and green curves denote the AGN-Hii separation from Kewley et al. (2013), corrected to redshifts of z = 0.1, 0.2 and 0.3, respectively. Filled red and green triangles represent the I08 and I07 objects, respectively. Open circles represent the GH04 objects. The I08 and I07 galaxies lie on the left side near the boundary separating AGN from star-forming regions. Their location is consistent with the stellar origin, but non-thermal radiation is not excluded. It is important to note that metal-poor AGN will have weaker [Nii] and [Oiii] emission, such that they migrate from the right side of the diagram to the left (e.g., Groves et al. 2006), making the standard diagnostic more ambiguous. Thus, the origin of the ionising process cannot be determined by this diagram alone. |
| In the text | |
|
Fig. 2 Hard X-ray (2–10 keV) emission compared to broad Hα emission (left) and [Oiii] emission (right). The I08 and I07 objects are denoted by red and green filled triangles, respectively. The best-fit regressions for AGN from P06 are shown as solid black lines, while the individual AGN used by P06 are shown as open black circles. The dotted line shows the hard X-ray (2–10 keV) – star formation rate relation presented by Ranalli et al. (2003) and Kennicutt (1998). Additional objects from GH04 and the literature are denoted by filled blue circles and filled grey triangles, respectively. Downward arrows denote X-ray upper limits for all samples. |
| In the text | |
|
Fig. 3 (Left) Rest-frame 2–10 keV X-ray and 6 μm luminosities for the I08 and I07 objects, calculated following the method described in Stern (2015). The dashed line indicates the best linear fit for AGN from Lutz et al. (2004), while the solid curve shows the AGN relation, corrected for high and low luminosities, from Stern (2015). (Right) Color–color diagram using the three most sensitive WISE bands 3.4 μm (W1), 4.6 μm (W2) and 12 μm (W3). The dashed line shows the demarcation between star-forming galaxies and AGN from Stern et al. (2012). The gray ellipse represents the region where most SDSS detected QSOs lie (Izotov et al. 2014). In both plots: the filled red and green triangles represent the I08 and I07 objects, respectively; downward arrows denote X-ray upper limits; and all objects are strongly detected by WISE such that their errors are smaller than the symbols representing them. |
| In the text | |
|
Fig. 4 Time evolution of the broad Hα luminosity for the I08 objects, as well as several luminous type IIn SNe (Kuncarayakti et al. 2016; Aretxaga et al. 1999; Stritzinger et al. 2012; Smith et al. 2008; Jencson et al. 2016) and the transient event SDSS1133 (Koss et al. 2014). The I08 objects are roughly constant over periods of 10−13 yr; there is some variability between epochs at the ~50% level, but this could be due to calibration uncertainties. All error bars are smaller than the symbols. |
| In the text | |
|
Fig. A.1 Optical spectra for galaxies J0045+1339 and J1222+3602 obtained using the LBT telescope on UT 2013 October 27 and UT 2015 May 18, respectively. The broad Hα flux does not present considerable variations compared to previous measurements. |
| In the text | |
|
Fig. A.2 Optical spectra for galaxies J1025+1402 and J1047+0739 obtained using the LRIS instrument on the Keck telescope on UT 2016 February 14. The broad Hα flux does not present considerable variations compared to previous measurements. |
| In the text | |
Current usage metrics show cumulative count of Article Views (full-text article views including HTML views, PDF and ePub downloads, according to the available data) and Abstracts Views on Vision4Press platform.
Data correspond to usage on the plateform after 2015. The current usage metrics is available 48-96 hours after online publication and is updated daily on week days.
Initial download of the metrics may take a while.