Fig. 2
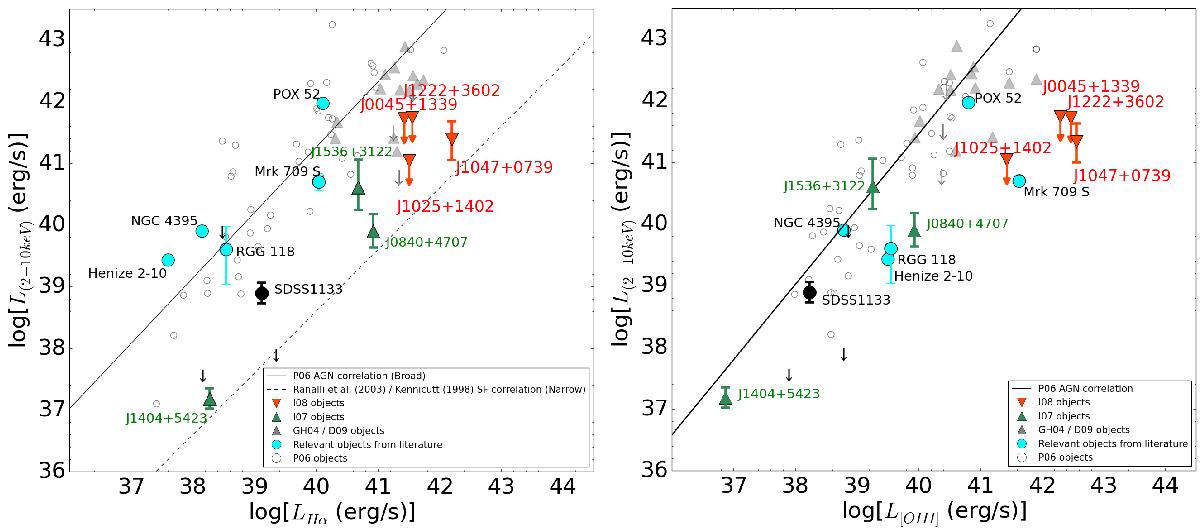
Hard X-ray (2–10 keV) emission compared to broad Hα emission (left) and [Oiii] emission (right). The I08 and I07 objects are denoted by red and green filled triangles, respectively. The best-fit regressions for AGN from P06 are shown as solid black lines, while the individual AGN used by P06 are shown as open black circles. The dotted line shows the hard X-ray (2–10 keV) – star formation rate relation presented by Ranalli et al. (2003) and Kennicutt (1998). Additional objects from GH04 and the literature are denoted by filled blue circles and filled grey triangles, respectively. Downward arrows denote X-ray upper limits for all samples.
Current usage metrics show cumulative count of Article Views (full-text article views including HTML views, PDF and ePub downloads, according to the available data) and Abstracts Views on Vision4Press platform.
Data correspond to usage on the plateform after 2015. The current usage metrics is available 48-96 hours after online publication and is updated daily on week days.
Initial download of the metrics may take a while.