Fig. 1
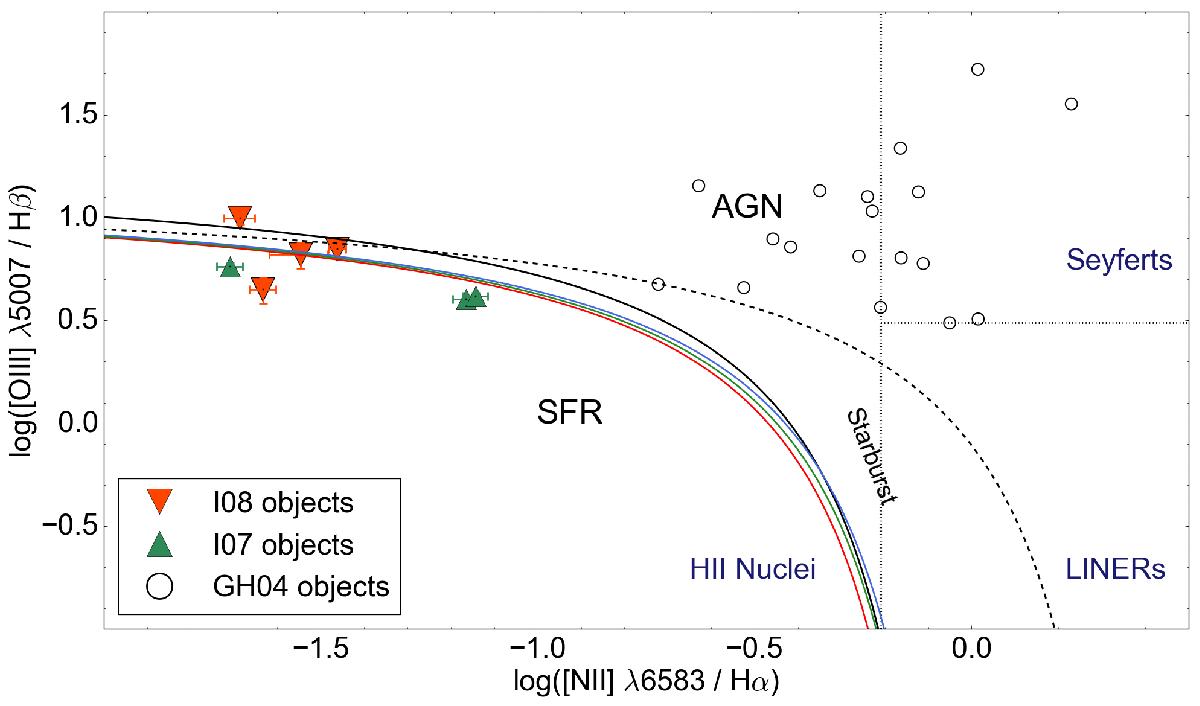
[Oiii]/Hβ against [Nii]/Hα narrow line emission ratios. Vertical and horizontal dotted lines mark the boundaries of the three main classes of emission line nuclei from Ho et al. (1997). The dashed curve shows the demarcation between starburst galaxies and AGNs defined by Kewley et al. (2001). The solid black curve shows the demarcation between star-forming Hii regions and starburst galaxies from Kauffmann et al. (2003), while the solid red, blue and green curves denote the AGN-Hii separation from Kewley et al. (2013), corrected to redshifts of z = 0.1, 0.2 and 0.3, respectively. Filled red and green triangles represent the I08 and I07 objects, respectively. Open circles represent the GH04 objects. The I08 and I07 galaxies lie on the left side near the boundary separating AGN from star-forming regions. Their location is consistent with the stellar origin, but non-thermal radiation is not excluded. It is important to note that metal-poor AGN will have weaker [Nii] and [Oiii] emission, such that they migrate from the right side of the diagram to the left (e.g., Groves et al. 2006), making the standard diagnostic more ambiguous. Thus, the origin of the ionising process cannot be determined by this diagram alone.
Current usage metrics show cumulative count of Article Views (full-text article views including HTML views, PDF and ePub downloads, according to the available data) and Abstracts Views on Vision4Press platform.
Data correspond to usage on the plateform after 2015. The current usage metrics is available 48-96 hours after online publication and is updated daily on week days.
Initial download of the metrics may take a while.