Fig. 3
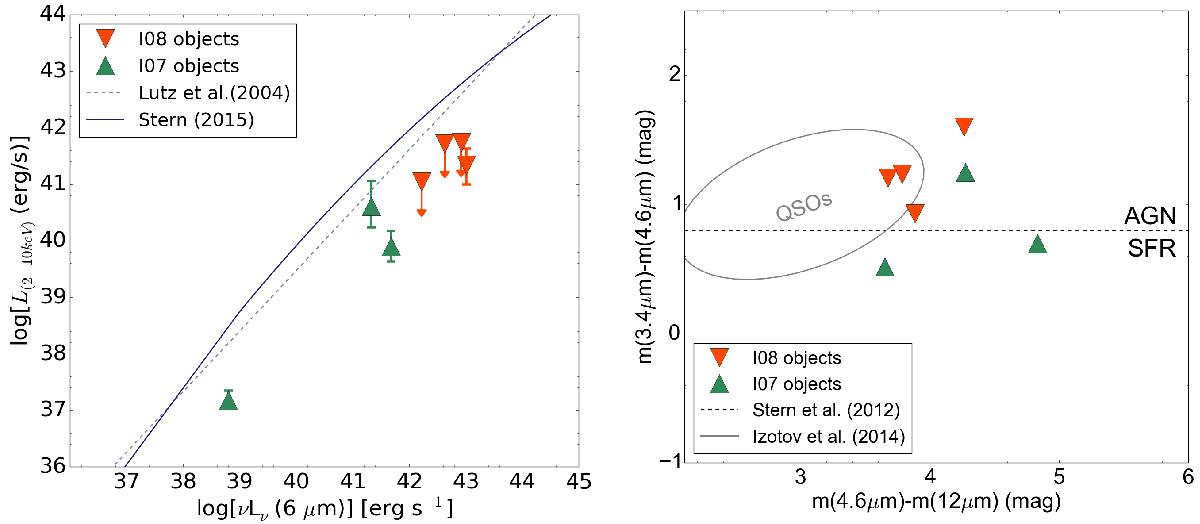
(Left) Rest-frame 2–10 keV X-ray and 6 μm luminosities for the I08 and I07 objects, calculated following the method described in Stern (2015). The dashed line indicates the best linear fit for AGN from Lutz et al. (2004), while the solid curve shows the AGN relation, corrected for high and low luminosities, from Stern (2015). (Right) Color–color diagram using the three most sensitive WISE bands 3.4 μm (W1), 4.6 μm (W2) and 12 μm (W3). The dashed line shows the demarcation between star-forming galaxies and AGN from Stern et al. (2012). The gray ellipse represents the region where most SDSS detected QSOs lie (Izotov et al. 2014). In both plots: the filled red and green triangles represent the I08 and I07 objects, respectively; downward arrows denote X-ray upper limits; and all objects are strongly detected by WISE such that their errors are smaller than the symbols representing them.
Current usage metrics show cumulative count of Article Views (full-text article views including HTML views, PDF and ePub downloads, according to the available data) and Abstracts Views on Vision4Press platform.
Data correspond to usage on the plateform after 2015. The current usage metrics is available 48-96 hours after online publication and is updated daily on week days.
Initial download of the metrics may take a while.