| Issue |
A&A
Volume 596, December 2016
|
|
|---|---|---|
| Article Number | A55 | |
| Number of page(s) | 10 | |
| Section | Astrophysical processes | |
| DOI | https://doi.org/10.1051/0004-6361/201628917 | |
| Published online | 29 November 2016 | |
Gamma rays detected from Cygnus X-1 with likely jet origin
1 Max-Planck-Institut fur Kernphysik, PO Box 103980, 69029 Heidelberg, Germany
e-mail: This email address is being protected from spambots. You need JavaScript enabled to view it.
2 Institut de Fisica d’Altes Energies (IFAE), The Barcelona Institute of Science and Technology (BIST), Campus UAB, 08193 Bellaterra (Barcelona), Spain
3 Institute of Space Sciences (CSIC-IEEC), 08193 Barcelona, Spain
4 Dublin Institute for Advanced Studies, 31 Fitzwilliam Place, Dublin 2, Ireland
5 Universitat de Barcelona, ICC, IEEC-UB, 08028 Barcelona, Spain
Received: 12 May 2016
Accepted: 16 September 2016
Abstract
Aims. We probe the high-energy (>60 MeV) emission from the black hole X-ray binary system, Cygnus X-1, and investigate its origin.
Methods. We analyzed 7.5 yr of data by Fermi-LAT with the latest Pass 8 software version.
Results. We report the detection of a signal at ~8σ statistical significance that is spatially coincident with Cygnus X-1 and has a luminosity of 5.5 × 1033 erg s-1, above 60 MeV. The signal is correlated with the hard X-ray flux: the source is observed at high energies only during the hard X-ray spectral state, when the source is known to display persistent, relativistic radio-emitting jets. The energy spectrum, extending up to ~20 GeV without any sign of spectral break, is well fit by a power-law function with a photon index of 2.3 ± 0.2. There is a hint of orbital flux variability, with high-energy emission mostly coming around the superior conjunction.
Conclusions. We detected GeV emission from Cygnus X-1 and probed that the emission is most likely associated with the relativistic jets. The evidence of flux orbital variability indicates the anisotropic inverse-Compton on stellar photons as the mechanism at work, thus constraining the emission region to a distance 1011–1013 cm from the black hole.
Key words: accretion, accretion disks / acceleration of particles / gamma rays: general / radiation mechanisms: non-thermal / stars: individual: Cygnus X-1 / X-rays: binaries
© ESO, 2016
1. Introduction
Cygnus X-1 is an X-ray binary (XRB), that is, a system in which the compact object accretes matter from the companion star. The compact object has been identified as a black hole (BH) with (14.8 ± 1.0) M⊙ (Orosz et al. 2011). The companion star is the early-type O9.7Iab supergiant HDE 226868 (Walborn 1973), with a mass of (19.2 ± 1.9) M⊙ (Orosz et al. 2011). However, this value has been questioned by Ziółkowski (2014), who suggested a range of 25–35 M⊙. Cygnus X-1 is the only Galactic high-mass XRB for which the compact object has been identified to be a BH.
Located at a distance of 1.86 kpc (Reid et al. 2011; Xiang et al. 2011), it is one of the brightest X-ray sources, and therefore is considered an optimal candidate for the study of the accretion and ejection processes onto a BH system. The spectrum of the BH X-ray binaries can be roughly described as the sum of two components: a blackbody-like emission from the geometrically thin and optically thick accretion disk, and a power-law tail, whose origin is still under debate. The dominance of one or the other component defines the two main spectral states that the system can display: the soft state (SS) and the hard state (HS). The two main states are joined by short-lived (typically of a few days; Grinberg et al. 2013) intermediate states (IS), and the complete sequence of states is well-represented in a hardness intensity diagram (HID) by the q-shaped track trajectory (Fender et al. 2004).
The SS is dominated by the thermal emission peaking at ~1 keV and a steep power-law at higher energies with a photon index Γ ~ 2–3. In the HS, instead, the blackbody component is much less luminous, with a 0.1 keV temperature, and most of the energy is emitted in a hard tail component characterized by a ~1.5 photon index and an exponential cutoff at a few hundred keV. The canonical explanation for this hard X-ray emission is inverse Compton scattering of disk photons by hot (kTe ~ 100 keV) thermal electrons in the inner region of the accretion flow, which is usually referred to as the “corona” (Shapiro et al. 1976; Sunyaev & Truemper 1979). However, Aharonian & Vardanian (1985) proposed that this emission has a non-thermal origin related to the development of electromagnetic cascades initiated by particles accelerated to relativistic energies in regions close to the BH, that is, in the accretion disk. In this scenario the authors showed that the resulting photon spectrum has a spectral break at most at ~1 MeV. In addition, the HS generally displays relatively persistent relativistic jets that emit synchrotron radiation at GHz radio frequencies, whereas in the SS, where the disk extends up to the BH last stable circular orbit of the BH, this emission is strongly quenched. A two-cluster non-linear correlation between the radio and the X-ray fluxes, with slopes of ~0.7 and ~1, respectively, suggests that the X-ray and the radio emitters are closely coupled (Gallo et al. 2003, 2012). The existence of such a correlation was used to prove a possible synchrotron origin of the X-ray power-law tail (Markoff et al. 2003).
As a persistent source, Cygnus X-1 always retains a strong power-law spectral component; even in its SS, its spectrum is never fully disk dominated. While in the HS it shows a mildly relativistic (v ~ 0.6 c) radio jet (Stirling et al. 2001; Gallo et al. 2003) that carries a significant fraction of the system X-ray luminosity (Gallo et al. 2005), in the SS there is evidence of an unresolved compact jet weaker by a factor 3−5 (Rushton et al. 2012). The constant mean level of the radio emission is ~10−15 mJy, with a flat spectrum and no evidence of a cutoff (Fender & Hendry 2000) up to IR frequencies, where the emission is entirely dominated by the supergiant, preventing the measurement of the spectral break. Another peculiarity of the Cygnus X-1 HS is that above the hard X-ray tail which cuts off at ~100 keV (Wilms et al. 2006), an additional harder (with a 1.6 photon index) non-thermal component emerges that extends up to a few MeV (Cadolle Bel et al. 2006; Rodriguez et al. 2015). This soft gamma-ray radiation was recently shown to be polarized with a polarization fraction increasing with energies and an average value of (76 ± 15)% at a position angle of (42 ± 3)° for energies above 230 keV (Laurent et al. 2011; Jourdain et al. 2012). The most plausible explanation for this is that the jet synchrotron emission itself extends up to MeV energies (Jourdain et al. 2012; Zdziarski et al. 2012), which in turn requires the existence of a parent population of ultra-relativistic electrons. In addition, this high-level of polarization would imply that the phenomenon is persistent on timescales of weeks to months. However, the origin of this emission is still controversial (Zdziarski & Gierliński 2004), and it was also suggested to originate in the corona (Romero et al. 2014). Therefore, the only proof that there is non-thermal gamma-ray jet emission would undoubtedly be the detection of GeV emission.
Cygnus X-1 spends most of its time in the HS, although the fraction of time observed in the SS is not constant with time. The latter increased from 10% between 1996 and 2000 to 34% between 2000 and mid-2006 (Wilms et al. 2006), most probably due to an overall increase in stellar radius. In this work we adopt the state definition described in Grinberg et al. (2013), who used the data of the available all-sky monitors RXTE-ASM, MAXI, Swift-BAT, and Fermi-GBM. The authors showed that publicly available Swift-BAT (15–50 keV) data can be used to distinguish SS from the HS+IS: the source is in the SS when the Swift-BAT daily count rate is lower than 0.09 cts cm-2 s-1. However, without soft coverage it is not possible to distinguish between the HS and the IS.
Cygnus X-1 BH is on a 5.6 d orbit. We adopted the most recently updated ephemerides in Gies et al. (2008), with a phase 0 corresponding to superior conjunction T0 = 52 872.788 HJD, that is, when the companion is between the observer and the BH (see the schematic diagram of the binary in Fig. 1). The orbital period is observed at all wavelengths: optical, infrared (Gies & Bolton 1982), X-ray (Brocksopp et al. 1999), and also at radio frequencies (Pooley et al. 1999), suggesting that the modulation could be the result of absorption by the stellar wind (Brocksopp et al. 2002). As confirmation, Grinberg et al. (2015) showed that the absorption column density in the HS is strongly modulated with a maximum around superior conjunction. The existence of the radio modulation supports the idea that radio emission comes from a continuous jet and not from discrete ejections. Another type of periodical behavior is observed in Cygnus X-1 at both X-ray and radio frequencies, a superorbital modulation of ~140 d (Brocksopp et al. 1999; Pooley et al. 1999), although this value is rather unstable and has recently been showed to be doubled (Lachowicz et al. 2006; Rico 2008; Zdziarski et al. 2011). The superorbital modulation might be possibly related to the precession of the disk-jet system (Brocksopp et al. 1999), or alternatively to a variable mass-accretion rate (Brocksopp et al. 2001), and its period possibly varies when an X-ray spectral state change occurs (Rico 2008).
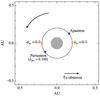 |
Fig. 1 Schematic diagram of Cygnus X-1. The orbital phase φ = 0 corresponds to the superior conjunction of the compact object. The orbit of the BH is indicated by the ellipse with an eccentricity of 0.018 (Orosz et al. 2011). Neither the inclination of the orbit with the line of sight nor the longitude of the ascending node were considered. The stellar radius, assumed to be 16.4 R⊙, and the periastron phase and argument were taken from Orosz et al. (2011). AU stands for astronomical unit. |
HE emission from BH XRB is theoretically predicted by either invoking leptonic or hadronic processes (e.g., Bosch-Ramon & Khangulyan 2009, for a review) and is generally tied to the existence of the radio jets, where particles can be accelerated up to relativistic energies. So far, the only microquasar (i.e., XRB displaying relativistic jets) firmly detected at high energies (>100 MeV) is Cygnus X-3 (Tavani et al. 2009; Fermi LAT Collaboration et al. 2009) and its gamma-ray emission is related to the formation or existence of the radio jets (Piano et al. 2012; Corbel et al. 2012). However, Malyshev et al. (2013) showed there is a 4σ-level evidence of gamma-ray signal for Cygnus X-1, above 100 MeV, in 3.8 yr of Fermi-LAT data, only when the source is in the HS. In addition to this steady emission, there are claims of isolated one- to two-day long flaring events reported by AGILE above 100 MeV (Sabatini et al. 2010, 2013) and of a flare of ≲1 d duration reported by the MAGIC collaboration above 100 GeV (Albert et al. 2007). In particular, AGILE detected three episodes of significant transient emission while it was in its pointing operational mode. These 1–2 d long events occurred on 2009, October 16 (0.38–0.56 orbital phase) with an integral flux of (2.32 ±0.66) × 10-6 ph cm-2 s-1 between 0.1 and 3 GeV (Sabatini et al. 2010); on 2010, March 24 (Bulgarelli et al. 2010) with a flux above 2.50 × 10⁻⁶ ph cm-2 s-1 above 100 MeV; and on 2010, June 30 with a (1.45 ±0.78) × 10-6 ph cm-2 s-1 average flux in the same energy range (Sabatini et al. 2013). While the first two episodes ocurred when the source was in the HS, the last episode occurred during a transition from the hard to the soft state, that was also coincident with the source entering in the SS and a few days before an anomalous radio flare (Negoro et al. 2010; Rushton et al. 2010; Wilson-Hodge & Case 2010). An independent analysis of 3.6 yr of Fermi-LAT data confirmed evidence of flaring activity on 1–2 d timescales contemporaneous, but not coincident, with AGILE at 3–4σ level (Bodaghee et al. 2013). These episodes show integral fluxes typically lower than those reported by AGILE, but still compatible within the large statistical uncertainties. The reported evidence (at 4σ post-trial) of very high-energy (VHE, >100 GeV) emission was detected by MAGIC on 2006, September 24 for 80 min (corresponding to an orbital phase of 0.9) when the source was in the HS (Albert et al. 2007), but it occurred exactly one day before a hard X-ray flare observed by INTEGRAL (Malzac et al. 2008). Additional long observational campaigns (~100 h) were carried out by MAGIC meant to catch additional short flaring episodes similar to the event in September 2006, but without success (Fernández-Barral et al. 2015). VERITAS did not report any VHE signal from Cygnus X-1 either (Guenette 2009).
In this work we search for both steady and variable emission from Cygnus X-1 at high energies, above 60 MeV, by using 7.5 yr of data by Fermi-LAT.
2. Observations and analysis
Fermi-LAT is an electron-positron pair production telescope, featuring solid-state silicon trackers and cesium iodide calorimeters, designed to be sensitive to photons from ~20 MeV up to >300 GeV (Atwood et al. 2009).
We used 7.5 yr of Pass 8 Fermi-LAT data from August 4, 2008 (MJD 54 682) to February 2, 2016 (MJD 57 420). The recently released Pass 8 data benefit from a wider energy range (from 60 MeV to 500 GeV), better energy resolution, improved point spread function (PSF), and significantly increased effective area. In addition, more accurate Monte Carlo simulations of the detector led to a reduction of the systematic uncertainty in the LAT instrument response functions (IRF). The data were reduced and analyzed using Fermipy1, a set of python tools that automatize the Pass 8 analysis with the Fermi Science Tools v10r0p5 package2. Standard Fermi Science Tools were also used to cross-check the recently released python package. We selected LAT photons from the P8R2_SOURCE class in the widest possible energy range between 60 MeV and 500 GeV and within a 30° acceptance cone centered on the position of Cygnus X-1 (RAJ2000 = 19h58m21.676s, Dec = +35°12m5.78s, van Leeuwen 2007). We chose 60 MeV as the lowest energy threshold because that is the lowest energy of the public Galactic diffuse model. The SOURCE event class was chosen to maximize the effective area, knowing that Cygnus X-1 is expected to be point-like. Thus, we used the corresponding P8R2_SOURCE_v16 IRF. Within any photon class, Pass 8 subdivides the events into quartiles according to the quality of either the direction (PSF event-type) or the energy reconstruction (EDISP event-type). In this work, we analyzed the four PSF event-types separately and later combined them by means of a joint likelihood fit. To minimize the contamination by the albedo gamma rays from the Earth, we excluded those photons whose directions were reconstructed with angles with respect to the local zenith larger than 90°, 85°, 75°, and 70° for the four PSF quartiles, respectively: the tighter, the better the PSF. Since our analysis is not very sensitive to the contamination from the Earth limb, and, in addition, our data sample includes data taken during the period of the Galactic-center-biased pointing strategy, we did not apply any cut on the rocking angle. The PSF event-type analysis has the best achievable angular resolution of the possible Fermi-LAT analysis; at 1 GeV it is ~0.5°, for example, which is a value between 0.8° and 0.3°. These are the angular resolutions of the analysis that uses the four PSF event-type in one single likelihood and of the one of the quartile with the best PSF (PSF3), respectively3. We cross-checked these results repeating the analysis with the standard conversion-type (FRONT+BACK) selection of events, and a conservative maximum zenith of 90°. The results obtained with the two selections are compatible within the expected improvements of the first approach.
We created 14°× 14° regions of interest (ROI) in Galactic coordinates. To model the diffuse background, we used the templates for the Galactic diffuse emission (gll_iem_v06.fits) and an isotropic component (iso_P8R2_SOURCE_V6_PSFx_v06.txt with x = 0,1,2,3) including the extragalactic diffuse emission and the residual background from cosmic rays4. We built a model of point-like gamma-ray background sources within 22° starting with the third LAT source catalog (3FGL, Acero et al. 2015), which is based on 4 yr of Pass 7 Reprocessed data. We let all the spectral parameters of all the sources, except those located more than 7° away from the center, free to vary in a maximum likelihood fit (using gtlike). We also let free the flux normalization of the Galactic diffuse and isotropic components and of the extremely bright 3FGL sources (significance >100) lying between 7° and 14° from the center.
We determined the source detection significance by fixing the source position to its nominal value given by van Leeuwen (2007), using the Test Statistic value, TS = − 2ln(L0/L1), which compares the likelihood ratio of models including an additional source, for instance, with the null hypothesis of background only (Mattox et al. 1996). The TS maps were computed for a power-law test source with a photon index of 2.5 and obtained with all the background sources fixed. The TS maps presented in this work were obtained above 1 GeV where the angular resolution is ~0.5°.
For the spectral analysis we split the 0.06–500 GeV energy range into seven logarithmically spaced bins. The spectral energy distribution (SED) was computed by fitting the source normalization factor in each energy bin independently while keeping its photon index fixed to the value found in the overall full energy range fit. The spectral parameters of the background sources were fixed to those previously found in the overall fit. For each spectral point we required a TS of at least 4, when this condition was not fulfilled, upper limits (UL) at 95% confidence level (CL) were computed.
We localized the source above 1 GeV with a two-step algorithm: this first determines the maximum peak in a reduced TS map of 4° × 4° centered on the considered source, and then redefines the source position by performing a full likelihood fit in the vicinity of the peak found in the first step5, with the normalization parameters of bright (TS > 100) background sources let free to vary.
The light curve, that is, the integral flux as a function of the observation time, is the only result that was not produced with the Fermipy software package, but with the standard FERMI SCIENCE TOOLS and with the standard conversion-type selection of events and a maximum zenith angle cut of 90°. The energy threshold for the light curve is 100 MeV to have a direct comparison with the previously published results (Sabatini et al. 2010, 2013; Bodaghee et al. 2013). We computed a maximum likelihood fit for each temporal bin of 1 d, and then we estimated either its 0.1−20 GeV integral flux or 95% CL UL depending on the strength of the signal, with a threshold of TS = 9.
3. Results
The TS map above 1 GeV obtained by using the background model including all the 3FGL sources is not flat. In addition to a clear excess in the center that is coincident with Cygnus X-1, the TS map shows seven excess spots with a TS larger than 25 in the full energy range, between 60 MeV and 500 GeV (see Fig. 2). We modeled these excess spots as power-law point-like sources, in particular:
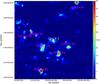 |
Fig. 2 5° × 5° TS map centered on the nominal position of Cygnus X-1 above 1 GeV obtained when including only the 3FGL sources in the background model. |
-
J1942+40: the LAT excess located atRAJ2000 = 19h:42m:7s and Dec = +40°:14m:7s most probably comes from the direction of the open cluster NGC 6819 where several X-ray sources were detected by the XMM-Newton observatory (Gosnell et al. 2012). In the full energy range the source has a TS of 55.
-
J1949+34: a LAT excess with a TS of 35 in the full energy range that is located at RAJ2000 = 19h:49m:7s and Dec = +34°:15m:44s.
-
J1955+33: an excess located at RAJ2000 = 19h:55m:10s, Dec = +33°:18m:34.8s, and with a TS of 90 in the full energy range.
-
J2005+34: a LAT excess centered on RAJ2000 = 20h:05m:19.7s, Dec = +34°:18m:23.7s with a TS of 49 above 60 MeV.
-
J2006+31: a clearly identified (TS = 115) new LAT source, outside of the Galactic Plane, it is centered on RAJ2000 = 20h:06m:12.8s, Dec = +31°:02m:38.3: is spatially coincident with the 164 ms period radio pulsar PSR J2006+3102 (Nice et al. 2013). We found that the LogParabola function provides a better (at more than 3σ level) fit of this source spectrum. Just for this specific case we included a non-power-law spectrum in our background model.
-
J2009+35: a LAT excess with a TS of 48 (above 60 MeV) located at RAJ2000 = 20h:09m:57.8 and Dec = +35°:44m:48.6s.
-
J2017+35: a LAT excess with a TS of 65, above 60 MeV, located at RAJ2000 = 20h:17m:25s and Dec = 35°:26m:5s.
The search for the origin of these excesses goes beyond the goal of this paper. Their location was estimated above 1 GeV and has a statistical uncertainty of ~0.2°. In addition, we found that the centroid of the LAT source associated with the supernova remnant (SNR) G73.9+0.9 is offset by 0.24° with respect to the position given in the 3FGL catalog (3FGL J2014.4+3606). The new centroid is located at RAJ2000 = 20h:13m:33.8s and Dec = 36°:11m:54.0s. The LogParabola spectral model suggested by the new Pass 8 analysis in Zdziarski et al. (2016b) is not significantly favored with respect to a power-law function, which was used in this work.
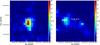 |
Fig. 3 2° × 2° TS maps centered on the nominal position of Cygnus X-1 above 1 GeV. Left: the Fermi-LAT data subsample corresponding to Cygnus X-1 being in the HS. Right: the data subsample corresponding to the SS of the source. The white cross indicates the nominal position of Cygnus X-1. |
When the new background sources were included in our model, a point-like source at the position of Cygnus X-1 was detected at TS = 53 in the full energy range, between 60 MeV and 500 GeV. Above 1 GeV the source is still detected at TS of 31. Of the new background sources included in our model, those that are more than 3° away from the Cygnus X-1 position do not have any effect on the source significance estimation, whereas the new background excesses lying within a 3° radius from the nominal Cygnus X-1 position decrease the TS of the signal from 65 to 53, when they are included in the background model. Applying the localization algorithm in the Fermipy package, we fit the position of the gamma-ray excess above 1 GeV to RAJ2000 = 19h:58m:56.8s and Dec = +35°:11m:4.4s, 0.05° offset from the nominal position, but still compatible with Cygnus X-1 within the statistical uncertainties of 0.2°. In addition to the spatial coincidence, we found a strong correlation of the gamma-ray excess with the X-ray spectral states. We divided our sample into HS(+IS) and SS by using the public Swift-BAT data (daily Swift-BAT count rate lower/higher than 0.09 cts cm-2 s-1, Grinberg et al. 2013), which has a complete temporal overlap with Fermi-LAT. We did not account for any soft X-ray information in our selection criteria, aiming to clearly identify all the IS intervals, because, given the short duration of the IS, their possible inclusion in the HS does not alter our result. The bottom panel in Fig. 6 shows the X-ray fluxes as a function of the time interval considered in this work (August 2008–February 2016), and the two X-ray spectral states are emphasized by the differently colored shadowed bands. In particular, the HS and SS intervals in MJD are listed in Table 1. We detected Cygnus X-1 when it was in the HS with a TS of 49 above 60 MeV and an energy flux integrated over the entire energy analysis range of (7.7 ±1.3) × 10-6 MeV cm-2 s-1. On the other hand, there is no significant LAT excess in coincidence with Cygnus X-1 when it is in the SS (TS = 7) and the UL on its energy flux above 60 MeV at 95% CL is 5.4 × 10⁻⁶ MeV cm-2 s-1. The two corresponding TS maps for energies higher than 1 GeV are shown in Fig. 3. Given the comparable exposure time for the two considered LAT subsamples of 3.6 yr and 3.7 yr for the HS and SS, respectively, we do not need to normalize with respect to it and we can confirm that Cygnus X-1 is detected at high significance only when the source is in the HS, as previously claimed by Malyshev et al. (2013), and recently confirmed by Zdziarski et al. (2016a). Some high-energy emission in the SS, although significantly fainter than in the HS, cannot be excluded. Spectral and timing results were then computed only for the HS subsample. We checked for a possible dependence on the orbital period of the flux. Owing to the low significance of the signal we divided the HS data sample into only two bins, one centered on the superior conjunction (φ> 0.75 | | φ< 0.25), and one on the inferior conjunction (0.25 <φ< 0.75). Cygnus X-1 is clearly detected in the full energy range with a TS of 31 only around the superior conjunction. In the second bin, around the inferior conjunction, no significant signal from the Cygnus X-1 position is seen (TS = 10). Figure 4 shows the corresponding two TS maps above 1 GeV. The energy flux above 60 MeV is (7.6 ±1.7) × 10-6 MeV cm-2 s-1 for the phase interval around superior conjunction. The low statistics does not allow us to make any strong conclusion on a possible flux dependence on the orbital position. Nevertheless, the low significance on the inferior conjunction phase bin, for the same exposure time, can be considered as a hint of the orbital modulation of the flux.
Days (MJD) intervals for the HS and SS.
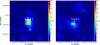 |
Fig. 4 Phase-dependent TS map of a 2°× 2° region centered on Cygnus X-1 (above 1 GeV) when the source is in the HS on the left around the superior conjunction and on the right around the inferior conjunction. |
The energy spectrum of Cygnus X-1 is well fit by a power-law function with a photon index Γ = (2.3 ± 0.1) and a normalization factor of N0 = (5.8 ±0.9) × 10-13 MeV-1 cm-2 s-1 at the decorrelation energy of 1.3 GeV, and it extends from 60 MeV to ~20 GeV. The obtained SED is illustrated in Fig. 5. We also tried to fit the LAT data with a broken power law, but the obtained improvement is not statistically significant (ΔTS < 2). The photon indices of the inferior and superior conjunction energy spectrum are compatible within 1σ with the overall HS ones. The flux normalization at 1.3 GeV for the superior and inferior conjunction, computed both with 2.3 photon index, is N0 = (5.7 ±1.3) × 10-13 MeV-1 cm-2 s-1, and N0 = (3.7 ±1.3) × 10-13 MeV-1 cm-2 s-1 for the superior and inferior conjunction, respectively.
We performed a timing analysis looking for the orbital period of 5.6 d, or possibly the super-orbital period. We applied the Lomb-Scargle test of uniformity (Lomb 1976), to our daily light curve for the HS data sample, where significant signal is detected, using the most probable value for the integral flux regardless the TS values. Between the maximum and minimum period sampled (2 and 1000 d), no periodicity is observed; the most significant periodicity is compatible at 3% with the null hypothesis of no periodicity.
We also searched for short flux variability on daily timescales as claimed by the AGILE collaboration. Figure 6 shows the light curve of the 7.5 yr of data with a one-day binning, in the 0.1–20 GeV energy range, where 20 GeV is the limit to which the Cygnus X-1 energy spectrum extends. No hint of variability at daily timescale is observed, and the distribution of the daily TS is consistent with the expected χ2 distribution. For completeness, Table 2 lists the nine days that show some signal with TS > 9. They are not clustered around previously reported daily variabilities, and none of them is coincident with the AGILE claims (Sabatini et al. 2010, 2013; Bulgarelli et al. 2010) and just one (MJD 55 292) with a 3σ event detected by Bodaghee et al. 2013. Nevertheless, possible differences on the exposure times and the effective area degradation due to large off-axis angles of the Cygnus X-1 daily observations by the two gamma-ray detectors AGILE and Fermi-LAT could explain this apparent contradiction, as has been shown for the case of AGL J2241+4454 (Munar-Adrover et al. 2016).
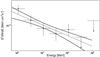 |
Fig. 5 SED of Cygnus X-1 in the HS, extending from 60 MeV to 20 GeV. It is best fit by a power-law function with a photon index Γ = (2.3 ± 0.1). |
4. Discussion
We established a new statistically significant LAT source above 60 MeV that is, spatially coincident with the prototype BH microquasar Cygnus X-1, and the previous marginal detections reported by Malyshev et al. (2013), Sabatini et al. (2010, 2013). The use of the more sensitive Pass 8 analysis software and 7.5 yr of data by Fermi-LAT allowed us to obtain the first high-significance detection of a BH binary at high energies, and we were also able to study a possible flux variability. The correlation between the HE and the hard X-ray flux, together with the hint of flux orbital modulation, strongly support the identification of the HE source with the microquasar. In particular, Cygnus X-1 is detected only when in the HS. During these periods, the emission is more significant (TS = 31) when the source is around the superior conjunction (0.25 < φ < 0.75), while it becomes fainter at inferior conjunction (TS = 10). The overall HS emission is well described by a 2.3 power-law function with a luminosity of the GeV emission of LGeV = 5 × 1033 erg s-1, a few orders of magnitude lower than the total power carried by the jets (1036–37 erg s-1; Gallo et al. 2005; Russell et al. 2007).
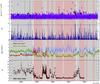 |
Fig. 6 Light curve of Cygnus X-1 obtained by the analysis of the Fermi-LAT data between August 4, 2008 and February 2, 2016 in 1 d bins. From top to bottom: the integral fluxes in the 0.1–20 GeV energy range, the TS corresponding to the above integral fluxes, the daily light curves in soft and hard X-rays from MAXI (cts s-1 cm-2 in 2–20 keV), RXTE-ASM (cts s-1 in 3–5 keV divided by 10) and Swift-BAT (×10 cts s-1 cm-2 in 15–50 keV), and the daily integral fluxes at 15 GHz by AMI. In the 0.1–20 GeV range, days with TS >9 are shown in the top panel as filled black circles, while the purple arrows represent the 95% CL UL for the bins with TS < 9. Dashed black vertical lines show the previously reported gamma-ray flares by AGILE. The horizontal green dot-dashed line in X-ray panel indicates the threshold level of the Swift-BAT count rate used in this work to separate the SS from the HS(+IS): 0.09 × 10 cts s-1 cm-2. The shadowed gray bands identify the HS(+IS), and the red bands the SS. |
Gamma-ray emission from XRB, and in particular from microquasars, has been predicted by several authors and associated with either the corona or the relativistic radio jets. Both leptonic (e.g. Atoyan & Aharonian 1999; Georganopoulos et al. 2002) and hadronic (Romero et al. 2003) mechanisms have been proposed in the literature to explain this high-energy radiation (see Bosch-Ramon & Khangulyan 2009, for a discussion on different processes). Leptonic models invoke inverse-Compton scattering on seed photons, where the target photon field depends on the production region, mainly on the distance from the BH. If particles are accelerated close to the BH (Kafatos et al. 1981), then the main target photons are the thermal photons from the accretion disk. When particles are accelerated along the relativistic jets, the seed photons can be either thermal photons from the accretion disk or synchrotron soft photons produced by the same population of electrons (synchrotron-self-Compton, SSC), or the photons from the companion star (with a blackbody peak emission at 2.7 × kT ~10 eV). The existence of synchrotron emission from the jet is supported by the hint of strong polarization in the 0.2–1 MeV tail (Laurent et al. 2011; Jourdain et al. 2012; Rodriguez et al. 2015), the luminosity of which is LMeV tail ~ 7 × 1035 erg s-1. The inverse-Compton scattering on stellar photons would be the dominant mechanism of high-energy radiation if the emission did not originate at the base of the jet. At a distance of a few times 1011 cm (see also Romero et al. 2014), the energy density of the stellar radiation field (ω⋆) becomes dominant with respect to the other two photon fields. In particular, 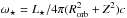 , where L⋆ = 7 × 1039 erg s-1 is the stellar luminosity (Orosz et al. 2011), Rorb is the orbital distance assumed to be 3 × 1012 cm, and Z is the distance from the BH along the jet, while ωsynch = LMeV tail/ 4πZ2c and ωaccretion = LsoftXray/ 4πZ2c, with LsoftXray the luminosity in the 1–20 keV energy range spanning from 1036 to 2 × 1037 erg s-1, depending on the model used to fit the soft part of the spectrum (Di Salvo et al. 2001). Particles could also be accelerated outside the binary system in shocks formed when the jets interact with the surrounding medium, as is likely to be the case in the microquasar SS 433 (Bordas et al. 2015). In particular, Cygnus X-1 jets are thought to inflate a ring-like (5 pc in diameter) structure, detected at radio frequencies (Gallo et al. 2005), and extending 1019 cm away from the BH. This value is assumed as the greatest extension of the relativistic jets.
When particles are accelerated to relativistic energies close to the BH, they could create electromagnetic cascades and generate gamma rays. These gamma rays will suffer heavy absorption through photon-photon collision. Following the approach of Aharonian et al. (1985), we can constrain the smallest region size for ~GeV photons to escape avoiding pair production on ~1 keV X-ray photons. Considering a spherical accretion geometry, and for a distance of 1.86 kpc (Orosz et al. 2011) and a de-absorbed flux at 1 keV of 1.6 × 10⁻⁹ erg cm-2 s-1 (Di Salvo et al. 2001), the emission region size must be larger than R> 2 × 109 cm. The radius of the corona, meant as the inner part of the accretion flow, is ~20–50 Rg ~ 5–10 × 107 cm (Poutanen & Coppi 1998), where Rg is the gravitational radius, therefore we can exclude that the observed GeV emission is produced in the inner regions of the accretion flow. This absorption also disfavors the advection-dominated accretion-flows (ADAF) models, predicting gamma-ray emission in the HS, when the ADAF flows are expected to be present (Mahadevan 1997). The GeV emission should be produced outside the corona, and is most likely associated with the jets. This conclusion is also strengthened because the system is only detected in the HS, when persistent jets have been detected at radio frequencies. Additional constraints on the production region can be obtained if the hint of flux dependence on the orbital phase peaking at around superior conjunction, as reported in this work, is finally confirmed. First of all, it sets an upper limit on the largest distance of the production region of a few times the size of the system (Rorb): Z< 1013 cm, thus confirming that the GeV emission cannot come from the region where the jets interact with the ring-like structure, but from the jets themselves. In addition, this flux variability is expected if the production mechanism of this GeV emission is anisotropic inverse-Compton scattering (Jackson 1972; Aharonian & Atoyan 1981; Zdziarski & Pjanka 2013; Khangulyan et al. 2014) on stellar photons. If no additional sources of variability are assumed, no variability is expected if either SSC or inverse-Compton with the thermal accretion photons is the dominant mechanism. Since the energy density of the stellar photons dominates the other possible photon fields only at distances Z> 1011 cm, the flux orbital modulation, if confirmed, constrains the GeV emitter to be located within a Z range 1011–1013 cm. This region is compatible with the results obtained by hydrodynamic simulations of stellar winds interacting with Cygnus X-1-like jets carrying a total power of ~1036–37 erg s-1 (Perucho & Bosch-Ramon 2008; Yoon et al. 2016; Bosch-Ramon & Barkov 2016).
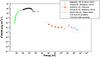 |
Fig. 7 Spectral energy distribution of Cygnus X-1 from X-rays up to TeV energies when in the HS, except for the MAGIC upper limits which were obtained by combining both SS and HS. Soft X-ray ( keV) data are taken from Di Salvo et al. (2001; by BeppoSAX), hard X-ray (10 keV–2 MeV) INTEGRAL from Fig. 3 in Rodriguez et al. (2015), and HE (30 MeV–20 GeV) results from this work and from the previously published results in Malyshev et al. (2013). At higher energies we show the differential UL on the steady emission obtained by the MAGIC collaboration (Albert et al. 2007), under the assumption of a 3.2 power law spectrum. The two gray curves are CTA-North differential sensitivities scaled for 5 and 200 h of observation taken from the CTA webpage https://portal.cta-observatory.org/Pages/CTA-Performance.aspx. No statistical errors are drawn. |
The energy of the parent population of electrons is at least several tens of GeV, and the inverse-Compton scattering occurs mostly in the Thompson regime. A moderate magnetic field of B ~ 10-2 G × η (where η is the acceleration efficiency: τacc = η/qBc where τacc is the acceleration timescale, and η> 1) would be enough to accelerate the inverse-Compton-emitting electron population up to a few tens of GeV (Khangulyan et al. 2008), enough to produce HE photons through inverse-Compton in the large stellar photon field. Under the assumption that the same population of electrons that produces the GeV emission by inverse Compton scattering on stellar photons at Z = 1011–1013 cm also emits synchrotron radiation at lower energies, the maximum magnetic field strength in this region is limited by the ratio between the luminosity of the observed X-ray emission, LX - ray, and the one of the detected high-energy radiation LGeV. Otherwise, the synchrotron X-ray flux would exceed the X-ray observations:  (1)where as LX - ray we considered the luminosity between 20 and 100 keV of 2.2 × 1037 erg s-1 (Cadolle Bel et al. 2006). At Z = 1012 cm the maximum magnetic field strength is of ~2 kG, decreasing to 700 G up to Z = 1013 cm.
At ~40 GeV, the energy spectrum should already be affected by gamma-ray absorption because of the pair creation in the stellar photon field. The created secondary pairs will mostly radiate inverse-Compton emission around the pair production energy threshold (~10–100 GeV), leading, for typical primary gamma-ray spectra, to the formation of a bump in the SED in that energy range. The ULs at the highest energies reported in this paper indicate that the spectrum does not harden above ~10 GeV. If gamma rays are indeed produced at energies ≳40 GeV, then significant inverse-Compton cascading seems unlikely, which would imply that either gamma-ray absorption is not attenuated by electromagnetic cascading in the GeV emitter, or that the emission is produced at the upper end of the inferred emitter Z-range, where this absorption is expected to be minor (Bosch-Ramon et al. 2008).
In analogy with Cygnus X-3, the only other microquasar firmly established at energies above 100 MeV, gamma-ray emission of Cygnus X-1 is related to the existence of relativistic jets. In both cases the GeV emission is most likely produced by inverse-Compton scattering on stellar photons (Fermi LAT Collaboration et al. 2009; Dubus et al. 2010). However, in contrast to Cygnus X-1, the conditions required to detect gamma rays from Cygnus X-3 are that the source is in the SS and shows significant emission (0.2–0.4 Jy) with rapid variations in the radio flux from the radio jets (Corbel et al. 2012). The latter is probably related to strong shocks (probably due to discrete jet ejections) occurring when the source undergoes state transitions in and out of the ultra-SS. While the nature of Cygnus X-3 HE emission is transitional, the gamma-ray detection of Cygnus X-1 seems persistent within the limited statistics whenever the jet is present or in other words, when the source is in the HS and shows a radio flux at 15 GHz higher than 10 mJy6. However, the daily flux variations weaker than ~1.5 × 10⁻⁶ ph cm-2 s-1 or variations on shorter timescales, as reported by the MAGIC collaboration (Albert et al. 2007), cannot be excluded (since Cygnus X-1 is not always in the field of view of the Fermi-LAT on a timescale of an hour). If confirmed, this could be associated with discrete jet ejections as well, as in the case of HE emission from Cygnus X-3.
The detection of the spectral break of the HE emission from Cygnus X-1 may be possible by combining 10 yr of Fermi-LAT data and the future generation of imaging atmospheric Cherenkov telescopes (IACT), the Cherenkov Telescope Array (CTA). Under the assumption of Pass 8 sensitivity, 10 yr of Fermi-LAT data will allow us to constrain a possible cutoff below 100 GeV, while CTA will be more sensitive above this energy in 200 h of observation. CTA could still detect a different emission component, possibly of hadronic origin (Pepe et al. 2015). The sensitivity curve of CTA for 200 hr of observations with the North array is included in the broad-band SED shown in Fig. 7. Moreover, CTA will be an ideal instrument to probe the short-term flux variability of Cygnus X-1 hinted by MAGIC that shows a flux that is one order of magnitude higher that the ULs obtained for the steady emission. Figure 7 illustrates the sensitivity curve of the CTA North array7 scaled to a few hours of observations, corresponding to the longest observation time for a specific source during 1 d.
See the Fermi Space Science Center (FSSC) Web site for details of the Science Tools: http://fermi.gsfc.nasa.gov/ssc/data/analysis/software
From public AMI-Large Array data. http://www.mrao.cam.ac.uk/~guy/cx1/
Acknowledgments
We would like to thank Luigi Tibaldo and Matthew Wood for the fruitful discussion about the Fermi analysis. We would also like to acknowledge Tiziana Di Salvo, Guy Pooley and Gabriela Vila for providing multi-wavelength historical data, and Marc Ribó and Pol Bordas for their valuable comments. R.Z. acknowledges the Alexander von Humboldt Foundation for the financial support and the Max-Planck Institut fur Kernphysik as hosting institution. The Spanish funding agency MINECO supported the work of O.B. and A.F.B. through the project FPA2012-39502, which includes ERDF funds, as well as the one of EdOW and D.G.F. and V.B.R. through the projects AYA2015-71042-P, AYA2013-47447-C3-1-P, respectively. The Catalan DEC supported EdOW through the grant SGR2012–1073m and D.G.F. and V.B.R. through the grant SGR2014-86. In addition, D.G.F. and V.B.R. acknowledge support from MINECO under grant MDM-2014-0369 of ICCUB (Unidad de Excelencia María de Maeztú) and BES-2014-069376. E.d.O. and V.B-R. also acknowledge financial support from MINECO and European Social Funds through a Ramón y Cajal fellowship. Finally, O.B. and A.F.B. are thankful for the support of the grant SEV-2012-0234 (Centro de Excelencia Severo Ochoa). This research has been supported by the Marie Curie Career Integration Grant 321520.
References
- Acero, F., Ackermann, M., Ajello, M., et al. 2015, ApJS, 218, 23 [Google Scholar]
- Aharonian, F. A., & Atoyan, A. M. 1981, Ap&SS, 79, 321 [NASA ADS] [Google Scholar]
- Aharonian, F. A., & Vardanian, V. V. 1985, Ap&SS, 115, 31 [NASA ADS] [CrossRef] [Google Scholar]
- Aharonian, F. A., Kririllov-Ugriumov, V. G., & Vardanian, V. V. 1985, Ap&SS, 115, 201 [NASA ADS] [CrossRef] [Google Scholar]
- Albert, J., Aliu, E., Anderhub, H., et al. 2007, ApJ, 665, L51 [NASA ADS] [CrossRef] [Google Scholar]
- Atoyan, A. M., & Aharonian, F. A. 1999, MNRAS, 302, 253 [NASA ADS] [CrossRef] [Google Scholar]
- Atwood, W. B., Abdo, A. A., Ackermann, M., et al. 2009, ApJ, 697, 1071 [NASA ADS] [CrossRef] [Google Scholar]
- Bodaghee, A., Tomsick, J. A., Pottschmidt, K., et al. 2013, ApJ, 775, 98 [NASA ADS] [CrossRef] [Google Scholar]
- Bordas, P., Yang, R., Kafexhiu, E., & Aharonian, F. 2015, ApJ, 807, L8 [NASA ADS] [CrossRef] [Google Scholar]
- Bosch-Ramon, V., & Barkov, M. V. 2016, A&A, 590, A119 [NASA ADS] [CrossRef] [EDP Sciences] [Google Scholar]
- Bosch-Ramon, V., & Khangulyan, D. 2009, Int. J. Mod. Phys. D, 18, 347 [NASA ADS] [CrossRef] [Google Scholar]
- Bosch-Ramon, V., Khangulyan, D., & Aharonian, F. A. 2008, A&A, 489, L21 [NASA ADS] [CrossRef] [EDP Sciences] [Google Scholar]
- Brocksopp, C., Fender, R. P., Larionov, V., et al. 1999, MNRAS, 309, 1063 [NASA ADS] [CrossRef] [Google Scholar]
- Brocksopp, C., Groot, P. J., & Wilms, J. 2001, MNRAS, 328, 139 [NASA ADS] [CrossRef] [Google Scholar]
- Brocksopp, C., Fender, R. P., & Pooley, G. G. 2002, MNRAS, 336, 699 [NASA ADS] [CrossRef] [Google Scholar]
- Bulgarelli, A., Pittori, C., Lucarelli, F., et al. 2010, ATel, 2512 [Google Scholar]
- Cadolle Bel, M., Sizun, P., Goldwurm, A., et al. 2006, A&A, 446, 591 [NASA ADS] [CrossRef] [EDP Sciences] [Google Scholar]
- Corbel, S., Dubus, G., Tomsick, J. A., et al. 2012, MNRAS, 421, 2947 [NASA ADS] [CrossRef] [Google Scholar]
- Di Salvo, T., Done, C., Życki, P. T., Burderi, L., & Robba, N. R. 2001, ApJ, 547, 1024 [NASA ADS] [CrossRef] [Google Scholar]
- Dubus, G., Cerutti, B., & Henri, G. 2010, MNRAS, 404, L55 [NASA ADS] [Google Scholar]
- Fender, R. P., & Hendry, M. A. 2000, MNRAS, 317, 1 [NASA ADS] [CrossRef] [Google Scholar]
- Fender, R. P., Belloni, T. M., & Gallo, E. 2004, MNRAS, 355, 1105 [NASA ADS] [CrossRef] [Google Scholar]
- Fermi LAT Collaboration, Abdo, A. A., Ackermann, M., et al. 2009, Science, 326, 1512 [NASA ADS] [CrossRef] [PubMed] [Google Scholar]
- Fernández-Barral, A., Blanch, O., de Oña Wilhelmi, E., et al. 2015, ArXiv e-prints [arXiv:1510.03101] [Google Scholar]
- Gallo, E., Fender, R. P., & Pooley, G. G. 2003, MNRAS, 344, 60 [NASA ADS] [CrossRef] [Google Scholar]
- Gallo, E., Fender, R., Kaiser, C., et al. 2005, Nature, 436, 819 [NASA ADS] [CrossRef] [PubMed] [Google Scholar]
- Gallo, E., Miller, B. P., & Fender, R. 2012, MNRAS, 423, 590 [NASA ADS] [CrossRef] [Google Scholar]
- Georganopoulos, M., Aharonian, F. A., & Kirk, J. G. 2002, A&A, 388, L25 [NASA ADS] [CrossRef] [EDP Sciences] [Google Scholar]
- Gies, D. R., & Bolton, C. T. 1982, ApJ, 260, 240 [NASA ADS] [CrossRef] [Google Scholar]
- Gies, D. R., Bolton, C. T., Blake, R. M., et al. 2008, ApJ, 678, 1237 [NASA ADS] [CrossRef] [Google Scholar]
- Gosnell, N. M., Pooley, D., Geller, A. M., et al. 2012, ApJ, 745, 57 [NASA ADS] [CrossRef] [Google Scholar]
- Grinberg, V., Hell, N., Pottschmidt, K., et al. 2013, A&A, 554, A88 [NASA ADS] [CrossRef] [EDP Sciences] [Google Scholar]
- Grinberg, V., Leutenegger, M. A., Hell, N., et al. 2015, A&A, 576, A117 [NASA ADS] [CrossRef] [EDP Sciences] [Google Scholar]
- Guenette, R., VERITAS Collaboration 2009, ArXiv e-prints [arXiv:0908.0714] [Google Scholar]
- Jackson, J. C. 1972, Nat. Phys. Sci., 236, 39 [NASA ADS] [CrossRef] [Google Scholar]
- Jourdain, E., Roques, J. P., Chauvin, M., & Clark, D. J. 2012, ApJ, 761, 27 [NASA ADS] [CrossRef] [Google Scholar]
- Kafatos, M., Shapiro, M. M., & Silberberg, R. 1981, Comm. Astrophys., 9, 179 [NASA ADS] [Google Scholar]
- Khangulyan, D., Aharonian, F., & Bosch-Ramon, V. 2008, MNRAS, 383, 467 [NASA ADS] [CrossRef] [Google Scholar]
- Khangulyan, D., Aharonian, F. A., & Kelner, S. R. 2014, ApJ, 783, 100 [NASA ADS] [CrossRef] [Google Scholar]
- Lachowicz, P., Zdziarski, A. A., Schwarzenberg-Czerny, A., Pooley, G. G., & Kitamoto, S. 2006, MNRAS, 368, 1025 [NASA ADS] [CrossRef] [Google Scholar]
- Laurent, P., Rodriguez, J., Wilms, J., et al. 2011, Science, 332, 438 [NASA ADS] [CrossRef] [PubMed] [Google Scholar]
- Lomb, N. R. 1976, Ap&SS, 39, 447 [NASA ADS] [CrossRef] [Google Scholar]
- Mahadevan, R. 1997, ApJ, 477, 585 [NASA ADS] [CrossRef] [Google Scholar]
- Malyshev, D., Zdziarski, A. A., & Chernyakova, M. 2013, MNRAS, 434, 2380 [NASA ADS] [CrossRef] [Google Scholar]
- Malzac, J., Lubiński, P., Zdziarski, A. A., et al. 2008, A&A, 492, 527 [NASA ADS] [CrossRef] [EDP Sciences] [Google Scholar]
- Markoff, S., Nowak, M., Corbel, S., Fender, R., & Falcke, H. 2003, A&A, 397, 645 [NASA ADS] [CrossRef] [EDP Sciences] [Google Scholar]
- Mattox, J. R., Bertsch, D. L., Chiang, J., et al. 1996, ApJ, 461, 396 [NASA ADS] [CrossRef] [Google Scholar]
- Munar-Adrover, P., Sabatini, S., Piano, G., et al. 2016, ApJ, 829, 101 [NASA ADS] [CrossRef] [Google Scholar]
- Negoro, H., Kawai, N., Kawasaki, Y. U. K., et al. 2010, ATel, 2711 [Google Scholar]
- Nice, D. J., Altiere, E., Bogdanov, S., et al. 2013, ApJ, 772, 50 [NASA ADS] [CrossRef] [Google Scholar]
- Orosz, J. A., McClintock, J. E., Aufdenberg, J. P., et al. 2011, ApJ, 742, 84 [NASA ADS] [CrossRef] [Google Scholar]
- Pepe, C., Vila, G. S., & Romero, G. E. 2015, A&A, 584, A95 [NASA ADS] [CrossRef] [EDP Sciences] [Google Scholar]
- Perucho, M., & Bosch-Ramon, V. 2008, A&A, 482, 917 [NASA ADS] [CrossRef] [EDP Sciences] [Google Scholar]
- Piano, G., Tavani, M., Vittorini, V., et al. 2012, A&A, 545, A110 [NASA ADS] [CrossRef] [EDP Sciences] [Google Scholar]
- Pooley, G. G., Fender, R. P., & Brocksopp, C. 1999, MNRAS, 302, L1 [NASA ADS] [CrossRef] [Google Scholar]
- Poutanen, J., & Coppi, P. S. 1998, Phys. Scr. Vol. T, 77, 57 [NASA ADS] [CrossRef] [Google Scholar]
- Reid, M. J., McClintock, J. E., Narayan, R., et al. 2011, ApJ, 742, 83 [NASA ADS] [CrossRef] [Google Scholar]
- Rico, J. 2008, ApJ, 683, L55 [NASA ADS] [CrossRef] [Google Scholar]
- Rodriguez, J., Grinberg, V., Laurent, P., et al. 2015, ApJ, 807, 17 [NASA ADS] [CrossRef] [Google Scholar]
- Romero, G. E., Torres, D. F., Kaufman Bernadó, M. M., & Mirabel, I. F. 2003, A&A, 410, L1 [NASA ADS] [CrossRef] [EDP Sciences] [Google Scholar]
- Romero, G. E., Vieyro, F. L., & Chaty, S. 2014, A&A, 562, L7 [NASA ADS] [CrossRef] [EDP Sciences] [Google Scholar]
- Rushton, A., Dhawan, V., Fender, R., et al. 2010, ATel, 2714 [Google Scholar]
- Rushton, A., Miller-Jones, J. C. A., Campana, R., et al. 2012, MNRAS, 419, 3194 [NASA ADS] [CrossRef] [Google Scholar]
- Russell, D. M., Fender, R. P., Gallo, E., & Kaiser, C. R. 2007, MNRAS, 376, 1341 [NASA ADS] [CrossRef] [Google Scholar]
- Sabatini, S., Tavani, M., Striani, E., et al. 2010, ApJ, 712, L10 [NASA ADS] [CrossRef] [Google Scholar]
- Sabatini, S., Tavani, M., Coppi, P., et al. 2013, ApJ, 766, 83 [NASA ADS] [CrossRef] [Google Scholar]
- Shapiro, S. L., Lightman, A. P., & Eardley, D. M. 1976, ApJ [Google Scholar]
- Stirling, A. M., Spencer, R. E., de la Force, C. J., et al. 2001, MNRAS, 327, 1273 [NASA ADS] [CrossRef] [Google Scholar]
- Sunyaev, R. A., & Truemper, J. 1979, Nature, 279, 506 [NASA ADS] [CrossRef] [Google Scholar]
- Tavani, M., Bulgarelli, A., Piano, G., et al. 2009, Nature, 462, 620 [NASA ADS] [CrossRef] [PubMed] [Google Scholar]
- van Leeuwen, F. 2007, A&A, 474, 653 [NASA ADS] [CrossRef] [EDP Sciences] [Google Scholar]
- Walborn, N. R. 1973, ApJ, 179, L123 [Google Scholar]
- Wilms, J., Nowak, M. A., Pottschmidt, K., Pooley, G. G., & Fritz, S. 2006, A&A, 447, 245 [NASA ADS] [CrossRef] [EDP Sciences] [Google Scholar]
- Wilson-Hodge, C. A., & Case, G. 2010, ATel, 2721 [Google Scholar]
- Xiang, J., Lee, J. C., Nowak, M. A., & Wilms, J. 2011, ApJ, 738, 78 [NASA ADS] [CrossRef] [Google Scholar]
- Yoon, D., Zdziarski, A. A., & Heinz, S. 2016, MNRAS, 456, 3638 [NASA ADS] [CrossRef] [Google Scholar]
- Zdziarski, A. A., & Gierliński, M. 2004, Prog. Theoret. Phys. Suppl., 155, 99 [Google Scholar]
- Zdziarski, A. A., & Pjanka, P. 2013, MNRAS, 436, 2950 [NASA ADS] [CrossRef] [Google Scholar]
- Zdziarski, A. A., Pooley, G. G., & Skinner, G. K. 2011, MNRAS, 412, 1985 [NASA ADS] [CrossRef] [Google Scholar]
- Zdziarski, A. A., Lubiński, P., & Sikora, M. 2012, MNRAS, 423, 663 [NASA ADS] [CrossRef] [Google Scholar]
- Zdziarski, A. A., Malyshev, D., Chernyakova, M., & Pooley, G. G. 2016a, MNRAS, submitted [arXiv:1607.05059] [Google Scholar]
- Zdziarski, A. A., Malyshev, D., de Oña Wilhelmi, E., et al. 2016b, MNRAS, 455, 1451 [NASA ADS] [CrossRef] [Google Scholar]
- Ziółkowski, J. 2014, MNRAS, 440, L61 [NASA ADS] [CrossRef] [Google Scholar]
All Tables
All Figures
|
Fig. 1 Schematic diagram of Cygnus X-1. The orbital phase φ = 0 corresponds to the superior conjunction of the compact object. The orbit of the BH is indicated by the ellipse with an eccentricity of 0.018 (Orosz et al. 2011). Neither the inclination of the orbit with the line of sight nor the longitude of the ascending node were considered. The stellar radius, assumed to be 16.4 R⊙, and the periastron phase and argument were taken from Orosz et al. (2011). AU stands for astronomical unit. |
| In the text | |
|
Fig. 2 5° × 5° TS map centered on the nominal position of Cygnus X-1 above 1 GeV obtained when including only the 3FGL sources in the background model. |
| In the text | |
|
Fig. 3 2° × 2° TS maps centered on the nominal position of Cygnus X-1 above 1 GeV. Left: the Fermi-LAT data subsample corresponding to Cygnus X-1 being in the HS. Right: the data subsample corresponding to the SS of the source. The white cross indicates the nominal position of Cygnus X-1. |
| In the text | |
|
Fig. 4 Phase-dependent TS map of a 2°× 2° region centered on Cygnus X-1 (above 1 GeV) when the source is in the HS on the left around the superior conjunction and on the right around the inferior conjunction. |
| In the text | |
|
Fig. 5 SED of Cygnus X-1 in the HS, extending from 60 MeV to 20 GeV. It is best fit by a power-law function with a photon index Γ = (2.3 ± 0.1). |
| In the text | |
|
Fig. 6 Light curve of Cygnus X-1 obtained by the analysis of the Fermi-LAT data between August 4, 2008 and February 2, 2016 in 1 d bins. From top to bottom: the integral fluxes in the 0.1–20 GeV energy range, the TS corresponding to the above integral fluxes, the daily light curves in soft and hard X-rays from MAXI (cts s-1 cm-2 in 2–20 keV), RXTE-ASM (cts s-1 in 3–5 keV divided by 10) and Swift-BAT (×10 cts s-1 cm-2 in 15–50 keV), and the daily integral fluxes at 15 GHz by AMI. In the 0.1–20 GeV range, days with TS >9 are shown in the top panel as filled black circles, while the purple arrows represent the 95% CL UL for the bins with TS < 9. Dashed black vertical lines show the previously reported gamma-ray flares by AGILE. The horizontal green dot-dashed line in X-ray panel indicates the threshold level of the Swift-BAT count rate used in this work to separate the SS from the HS(+IS): 0.09 × 10 cts s-1 cm-2. The shadowed gray bands identify the HS(+IS), and the red bands the SS. |
| In the text | |
|
Fig. 7 Spectral energy distribution of Cygnus X-1 from X-rays up to TeV energies when in the HS, except for the MAGIC upper limits which were obtained by combining both SS and HS. Soft X-ray ( keV) data are taken from Di Salvo et al. (2001; by BeppoSAX), hard X-ray (10 keV–2 MeV) INTEGRAL from Fig. 3 in Rodriguez et al. (2015), and HE (30 MeV–20 GeV) results from this work and from the previously published results in Malyshev et al. (2013). At higher energies we show the differential UL on the steady emission obtained by the MAGIC collaboration (Albert et al. 2007), under the assumption of a 3.2 power law spectrum. The two gray curves are CTA-North differential sensitivities scaled for 5 and 200 h of observation taken from the CTA webpage https://portal.cta-observatory.org/Pages/CTA-Performance.aspx. No statistical errors are drawn. |
| In the text | |
Current usage metrics show cumulative count of Article Views (full-text article views including HTML views, PDF and ePub downloads, according to the available data) and Abstracts Views on Vision4Press platform.
Data correspond to usage on the plateform after 2015. The current usage metrics is available 48-96 hours after online publication and is updated daily on week days.
Initial download of the metrics may take a while.