Fig. 7
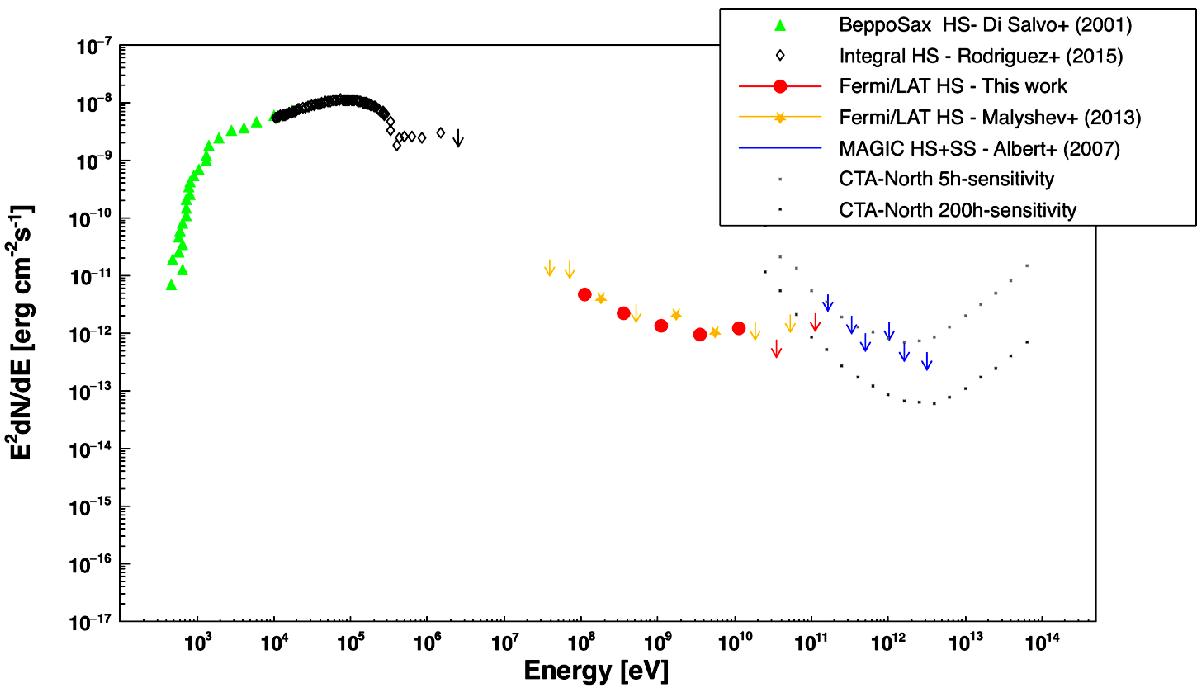
Spectral energy distribution of Cygnus X-1 from X-rays up to TeV energies when in the HS, except for the MAGIC upper limits which were obtained by combining both SS and HS. Soft X-ray ( keV) data are taken from Di Salvo et al. (2001; by BeppoSAX), hard X-ray (10 keV–2 MeV) INTEGRAL from Fig. 3 in Rodriguez et al. (2015), and HE (30 MeV–20 GeV) results from this work and from the previously published results in Malyshev et al. (2013). At higher energies we show the differential UL on the steady emission obtained by the MAGIC collaboration (Albert et al. 2007), under the assumption of a 3.2 power law spectrum. The two gray curves are CTA-North differential sensitivities scaled for 5 and 200 h of observation taken from the CTA webpage https://portal.cta-observatory.org/Pages/CTA-Performance.aspx. No statistical errors are drawn.
Current usage metrics show cumulative count of Article Views (full-text article views including HTML views, PDF and ePub downloads, according to the available data) and Abstracts Views on Vision4Press platform.
Data correspond to usage on the plateform after 2015. The current usage metrics is available 48-96 hours after online publication and is updated daily on week days.
Initial download of the metrics may take a while.