Fig. 6
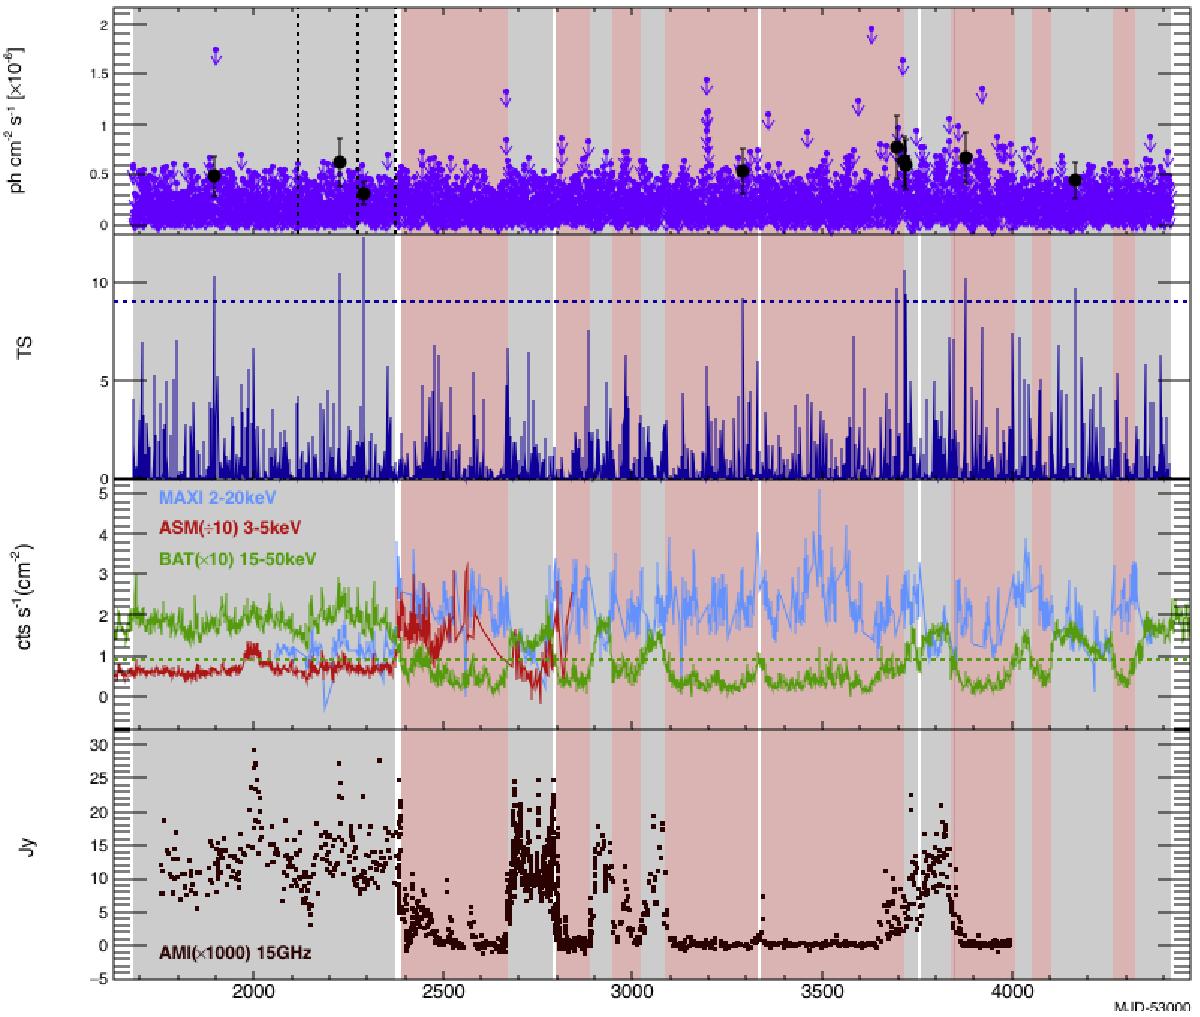
Light curve of Cygnus X-1 obtained by the analysis of the Fermi-LAT data between August 4, 2008 and February 2, 2016 in 1 d bins. From top to bottom: the integral fluxes in the 0.1–20 GeV energy range, the TS corresponding to the above integral fluxes, the daily light curves in soft and hard X-rays from MAXI (cts s-1 cm-2 in 2–20 keV), RXTE-ASM (cts s-1 in 3–5 keV divided by 10) and Swift-BAT (×10 cts s-1 cm-2 in 15–50 keV), and the daily integral fluxes at 15 GHz by AMI. In the 0.1–20 GeV range, days with TS >9 are shown in the top panel as filled black circles, while the purple arrows represent the 95% CL UL for the bins with TS < 9. Dashed black vertical lines show the previously reported gamma-ray flares by AGILE. The horizontal green dot-dashed line in X-ray panel indicates the threshold level of the Swift-BAT count rate used in this work to separate the SS from the HS(+IS): 0.09 × 10 cts s-1 cm-2. The shadowed gray bands identify the HS(+IS), and the red bands the SS.
Current usage metrics show cumulative count of Article Views (full-text article views including HTML views, PDF and ePub downloads, according to the available data) and Abstracts Views on Vision4Press platform.
Data correspond to usage on the plateform after 2015. The current usage metrics is available 48-96 hours after online publication and is updated daily on week days.
Initial download of the metrics may take a while.