| Issue |
A&A
Volume 595, November 2016
|
|
|---|---|---|
| Article Number | L6 | |
| Number of page(s) | 6 | |
| Section | Letters | |
| DOI | https://doi.org/10.1051/0004-6361/201629776 | |
| Published online | 31 October 2016 | |
TOPoS
III. An ultra iron-poor multiple CEMP system ⋆
1 GEPI, Observatoire de Paris, PSL Research University, CNRS, Univ. Paris Diderot, Sorbonne Paris Cité, Place Jules Janssen, 92190 Meudon, France
e-mail: This email address is being protected from spambots. You need JavaScript enabled to view it.
2 Departamento de Ciencias Fisicas, Universidad Andres Bello, 220 Republica, Santiago, Chile
3 European Southern Observatory, Casilla 19001, Santiago, Chile
4 UPJV, Université de Picardie Jules Verne, 33 rue St Leu, 80080 Amiens, France
5 Laboratoire Univers et Particules de Montpellier, LUPM, Université de Montpellier, CNRS, 34095 Montpellier Cedex 5, France
6 Istituto Nazionale di Astrofisica, Osservatorio Astronomico di Padova Vicolo dell’Osservatorio 5, 35122 Padova, Italy
7 Zentrum für Astronomie der Universität Heidelberg, Landessternwarte, Königstuhl 12, 69117 Heidelberg, Germany
8 Phyics Department, Lancaster University, Lancaster LA1 4YB, UK
9 Leibniz-Institut für Astrophysik Potsdam (AIP), An der Sternwarte 16, 14482 Potsdam, Germany
10 Zentrum für Astronomie der Universität Heidelberg, Institut für Theoretische Astrophysik, Albert-Ueberle-Straβ 2, 69120 Heidelberg, Germany
11 Interdisziplinäres Zentrum für Wissenschaftliches Rechnen (IWR) der Universität Heidelberg
Received: 22 September 2016
Accepted: 7 October 2016
Abstract
Aims. One of the primary objectives of the TOPoS survey is to search for the most metal-poor stars. Our search has led to the discovery of one of the most iron-poor objects known, SDSS J092912.32+023817.0. This object is a multiple system, in which two components are clearly detected in the spectrum.
Methods. We have analysed 16 high-resolution spectra obtained using the UVES spectrograph at the ESO 8.2 m VLT telescope to measure radial velocities and determine the chemical composition of the system.
Results. Cross correlation of the spectra with a synthetic template yields a double-peaked cross-correlation function (CCF) for eight spectra, and in one case there is evidence for the presence of a third peak. Chemical analysis of the spectrum obtained by averaging all the spectra for which the CCF showed a single peak found that the iron abundance is [Fe/H] = −4.97. The system is also carbon enhanced with [C/Fe] = +3.91 (A(C) = 7.44). From the permitted oxygen triplet we determined an upper limit for oxygen of [O/Fe] < +3.52 such that C/O > 1.3. We are also able to provide more stringent upper limits on the Sr and Ba abundances ([Sr/Fe] < +0.70, and [Ba/Fe] < +1.46, respectively).
Key words: stars: Population II / stars: abundances / binaries: spectroscopic / Galaxy: abundances / Galaxy: formation / Galaxy: halo
Based on observations made with ESO Telescopes at the La Silla Paranal Observatory under programme ID 094.D-0488 and 096.D-0616.
© ESO, 2016
1. Introduction
Carbon enhanced metal-poor (CEMP) stars are characterised by a low iron content, [Fe/H] ≲ − 2.0 dex and an over-abundance in C, [C/Fe] > + 1.0 dex (Beers & Christlieb 2005). CEMP stars very often show over-abundances of nitrogen and oxygen, sometimes show over-abundances of magnesium and sodium, and exhibit a wide distribution of heavy elements. CEMP stars enriched in heavy elements, synthesised by both the slow (s-) and the rapid (r-) process, are referred to as CEMP-r/s stars; those enriched in heavy elements synthesised solely by the s-process are CEMP-s stars. CEMP stars with a “normal” chemical pattern of the heavy elements (i.e. [Ba/Fe] < +1.0) are defined as CEMP-no stars. Spite et al. (2013) pointed out that CEMP stars are divided into two groups according to their absolute carbon abundance (see also Masseron et al. 2010). Bonifacio et al. (2015) suggested that stars whose carbon has been accreted from a more evolved companion belong to the high-carbon band (with A(C) ≈ 8.25, Bonifacio et al. 2015) while stars formed from Fe-poor gas clouds and showing no sign of late mass transfer belong to the low-carbon band (with A(C) ≈ 6.8, Bonifacio et al. 2015). According to this picture, we expect all stars of the high-carbon band to be binary (see Lucatello et al. 2005; Starkenburg et al. 2014; Hansen et al. 2016a,b). In contrast, prior to the present paper, only seven CEMP-no stars were known to exhibit direct evidence of binarity.
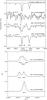 |
Fig. 1 Upper panel: three representative spectra of SDSS J0929+0238 in the range of Ca ii-K (vertical dotted line) obtained on different dates and smoothed by 10 km s-1. The presence of several stars contributing to the spectra is evident from the clear asymmetry of Ca ii-K (highlighted by the vertical dashed lines) in the spectra corresponding to the multiple peak in the CCF. Lower panel: the corresponding cross-correlation functions. |
We present the analysis of a binary, or perhaps trinary CEMP system, SDSS J092912.32+023817.0 (henceforth referred to as SDSS J0929+0238), selected in the TOPoS project (Caffau et al. 2013).
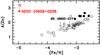 |
Fig. 2 Zinc abundance as a function of metallicity. The measurement for BS 16920-017 is from Honda et al. (2011), that of BD+44° 493 is from Roederer et al. (2016). the open circles are giants (Cayrel et al. 2004), filled circles are dwarfs (Bonifacio et al. 2009), downward arrows are upper limits for dwarfs (Bonifacio et al. 2009). The two red open circles are CEMP-no stars. The red full circle with a question mark is the Zn abundance derived in the case of log g = 4.5 for SDSS J0929+0238. |
2. Observations
We observed SDSS J0929+0238 using the UV-Visual Echelle Spectrograph (UVES Dekker et al. 2000) mounted at the Nasmyth platform B of the Unit 2 telescope (UT2) of the Very Large Telescope (VLT, Paranal observatory, Chile). Observations were conducted using the standard setting DIC2 437+760, which simultaneously covers the wavelength ranges 373−499 nm and 565−946 nm, with its blue and red arms, respectively. Observations were collected in Service Mode during the period 8th February to 11th March, 2015 (program ID: 094.D-0488(A)) and 19th November, 2015 to 5th March, 2016 (096.D-0616(A)). A 1.6′′-wide slit was adopted for both arms, and the CCD was binned two by two. The spectral resolution corresponding to the adopted slit is R = 28 000 and R = 29 000 in the red and blue arms, respectively. A total of 16 observations with individual exposure times of 3005 s were taken. Spectra were reduced by the ESO staff and retrieved from the ESO archive with the ESO Spectral Data Products Query Form. Three exposures not present in the archive were reduced using the UVES CLP-based pipeline version 5.5.5. Only the “scired” recipe was applied to the science frames, using the best reduced master calibrations associated to the frames by the archive query system.
3. Analysis and results
The X-shooter spectrum of SDSS J0929+0238 has been analysed in Bonifacio et al. (2015) with the stellar parameters Teff = 5894 K and log g = 3.7. At that time, we pointed out a disagreement in the radial velocity derived from the X-shooter (398 ± 10 km s-1) and the SDSS (467 ± 10 km s-1) spectra. We could not detect any iron lines and provide an upper limit of [Fe/H] < − 3.81 from the X-shooter spectrum. There are very few lines available to measure the radial velocity from the individual exposures due to the low metallicity and relatively high temperature of the system. Since the system is carbon-enhanced, the G-band is fairly prominent and we found that it is suitable for radial velocity measurements. We cross-correlated each exposure with a synthetic spectrum based on the results of Bonifacio et al. (2015; Teff = 5894 K, log g = 3.7, A(C) = 7.7, [Fe/H] = − 4.5). In 8 out of 16 cases the cross correlation function (CCF) showed a clear double-peak and in one case we have a tentative detection of a triple-peak. For all 16 observations, the radial velocities and the circumstances of the observation are listed in Table A.1. When multiple peaks are present, we report the radial velocity corresponding to each peak. When there is a single peak, the radial velocity should be accurate to better than 1 km s-1, with the error dominated by the uncertainty on the centring of the object on the slit (see e.g. Molaro et al. 2008). However, when multiple peaks are present, the error is dominated by the uncertainty in the fitting of the multiple peaks, and, from repeated measurements with slightly different fitting intervals, we estimate this to be as large as 2 km s-1. However, we report all velocities with a precision of 100 m s-1 to avoid rounding errors in future period searches and orbital analyses.
In the observation of 19th February 2015 (MJD = 57 072.075512012), the two peaks of the CCF are well separated (by 27.6 km s-1) and a secondary component of the Ca ii-K line is visible in the spectrum (see Fig. 1 for the observed spectrum and CCF denoted by (b)). This object is therefore a double-lined spectroscopic (SB2) system, with evidence (CCF (c), Fig. 1) that suggests it is possibly a triple-lined spectroscopic (SB3) system on the observation of 15th February 2015. From the relative strengths of the cross-correlation peaks and the Ca ii-K line of the spectrum of 19th February 2015, we deduce that the two main stars have to be very similar in temperature and luminosity. This implies that they are both on the main sequence. If one of the two components were on the sub-giant branch, its luminosity would be two magnitudes brighter, severely reducing the visibity of the companion’s spectrum. We consider it very unlikely that both stars are on the sub-giant branch since their masses should be identical to within 0.5%.
In order to explore possible values for the Teff of the two components, we compared the observed (g − z)0 = 0.511 of the system to the theoretical colours obtained by combining the fluxes from pairs of stars whose temperatures and luminosities lie along an isochrone of 14 Gyr and metallicity Z = 10-6 (Chieffi, priv. comm.). The combinations with (g − z)0 closest to the observed (all well within the uncertainty, the uncertainty in the g and z magnitudes being of the order of 0.02) are: 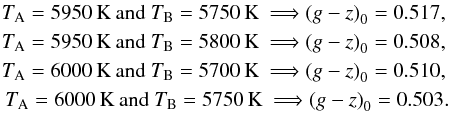 We compared the combined synthetic spectrum in the range of the Ca ii-K line to the spectrum of 19th February 2015 that has the most separated double-peaked CCF (see CCF (b), Fig. 1). For a case where the primary star has a temperature TA = 6000 K, the secondary peak is less evident. The shape of the line is best reproduced when the primary star has a temperature TA ~ 5950 K and the secondary is in the temperature range 5750 <TB< 5800 K. For this small difference in Teff of less than 200 K, the gravity of a main sequence star changes very little (<0.05 dex), therefore we do not expect a significant amount of information from the gravity sensitive (u − g) colour that would disentangle the system.
We analysed the spectrum obtained by co-adding the seven spectra that have a single peaked CCF. We assume that the stars in the system have been formed together and are not the result of a tidal capture. As stated above, the main stars in the system are at an evolutionary stage well before the first dredge-up takes place, so that neither the abundance of C or N have been changed. In this picture we can safely assume that the stars share the same chemical composition. Apart from the CH lines of the G-band, only six lines were clearly identified in the spectrum with a seventh ad interim detection. To derive the chemical abundances, we fitted the line profiles (Bonifacio & Caffau 2003) with synthetic spectra computed by Turbospectrum (Plez 2012) based on MARCS model atmospheres (Gustafsson et al. 2008) used in Bonifacio et al. (2015) with an effective temperature derived from the colours of 5894 K, and two values of log g: sub-giant star-like, log g = 3.7, and main sequence star-like, log g = 4.5. We could not derive the micro-turbulence from the observed spectrum and so fixed it at 1.5 km s-1. The abundances we derived are listed in Table 1 for both cases. Since the two stars are very similar, the veiling correction, when the stars appear at the same radial velocity (single peaked CCF), is very small. We verified with synthetic spectra that if the two components have the same radial velocities and their Teff are within 250 K, the impact of veiling on the spectrum, when compared to a single star synthesis, is well within our observational uncertainty. In Table 1 we also report upper limits for O (O i at 777.1 nm), Sr (Sr ii at 407.7 nm) and Ba (Ba ii at 455.4 nm), based on a 3σ deviation estimated by Cayrel’s formula (Cayrel 1988). For Li, a signal-to-noise (S/N) ratio of approximately 70 in the range implies A(Li) < 1.3, at 3σ, using the 3D-NLTE formula of Sbordone et al. (2010); this put the stars in the Li-meltdown region. The 3D corrections for the G-band would increase A(C) by approximately 0.05 dex (see Gallagher et al. 2016).
At 4.6 km s-1 to the blue (corresponding to 481.045 nm) from the theoretical position of the Zn i line at 481.0528 nm there is a feature with the shape of an absorption line. To our knowledge, in this metallicity regime, there is no other possible identification for this line. We fitted the line profile assuming it is Zn i and derived [Zn/H] = − 1.86 (see Fig. A.1). The strength of the line with an equivalent width (EW) of 1.3 pm, makes the line at the limit of detection. With a S/N of approximately 30 in the range, the 3σ EW detection, according to Cayrel’s formula, is 1.0 pm. The weaker Zn i line at 472.2153 nm is not detected. However, the spectrum is consistent with the presence of a line corresponding to the above Zn abundance and shifted to the blue by 4.6 km s-1.
Abundances of the SDSS J0929+0238 system.
4. Discussion and conclusions
We have reported the discovery and analysis of a multiple system of CEMP stars. The fact that cross-correlation on the G-band displays multiple peaks on some dates implies that all the components are CEMP stars. In our view this makes it very unlikely that the C-enhancement is the result of mass transfer from an AGB companion. In the case of the CEMP-s double-lined binary CS 22964-161, Thompson et al. (2008) argued that this was the case and suggested that the system was born as a hierarchical triple system with a close binary that orbits a relatively low-mass AGB progenitor. If the presence of the third star is confirmed, this would make SDSS J0929+0238 even more complex, being the evolution of a hierarchical quadruple system. In the following we do not elaborate on this scenario further and assume, as a working hypothesis, that the chemical composition of the stars reflects that of the chemical composition of the cloud from which they have been formed. The upper limits on Sr and Ba have been greatly improved with respect to Bonifacio et al. (2015), however, they are still not stringent enough to allow for classification of the system as a CEMP-no ([Ba/Fe] < 1.0, following Masseron et al. 2010) system. Bonifacio et al. (2015) argued that stars on the low-carbon band are CEMP-no stars. Yoon et al. (2016) arrived at a similar conclusion, albeit with a different definition of a CEMP star. To confirm its CEMP-no nature, one would need a S/N ≈ 100 in the region of the Ba ii resonance line. The 7 h of observations analysed here only give a S/N = 35. This means that one would need to add approximately fifty more hours of integration.
There is a discrepancy between the Ca abundance derived from the Ca ii-K line and Ca ii IR triplet. Taking into account departures from NLTE worsens this discrepancy. Looking at the NLTE corrections by Caffau et al. (2012) for SDSS J102915+172927,whose parameters are similar, we see that the abundance from the K line should be corrected by −0.1 dex and that from the IR triplet, by –0.2 dex. A straight average of the abundances of the two lines implies [Ca/Fe] = + 0.6 in LTE and +0.45 in NLTE; both are typical values for metal-poor stars.
The tentative detection of a Zn i line is surprising. The line is very weak, and the fact that it is shifted in wavelength casts some doubt on its identification. We have considered carbon-bearing molecules as responsible for this absorption and the only possible candidates are C2 lines that do not fall at the right wavelength, nor have the correct strength, even after considering the large C over-abundance implied by the G-band. Let us assume, for the sake of discussion, that the Zn abundance in the system is indeed as high as is implied by the absorption line shown in Fig. A.1, [Zn/Fe] ≈ + 3.0. Figure 2 depicts this star in the context of other EMP stars from the First Stars project (Cayrel et al. 2004; Bonifacio et al. 2009). The absolute zinc abundance of SDSS J0929+0238 is not different from what is found in more metal-rich stars, but it is very high for its exceptionally low Fe abundance. This makes its [Zn/Fe] ratio over two orders of magnitude larger than that seen elsewhere. Furthermore, SDSS J0929+0238 is a CEMP-no star, likely formed in a gas cloud polluted by primordial faint supernovae with mixing and fallback (e.g. Bonifacio et al. 2015; Salvadori et al. 2015). These Pop III stars only eject small amounts of zinc, implying that other sources must produce this heavy element while essentially not releasing iron. An increase in the [Zn/Fe] ratio at low [Fe/H] was noted by Cayrel et al. (2004) and attributed to α-rich freeze-out processes. It is also significant that for [Fe/H] < − 4.0 there are no measurements of Zn abundance at all. To our knowledge Zn has only been measured in two other CEMP-no stars at [Fe/H] ≈ − 4: CS 22949–037 that has [Zn/Fe] = + 0.7 (Depagne et al. 2002, Fig. 2) and BD+44° 493 (Roederer et al. 2016), [Zn/Fe] = − 0.1. This suggests that there may be a real scatter in Zn abundances towards lower [Fe/H] as discussed in Bonifacio et al. (2009). At higher [Fe/H], Honda et al. (2011) measured [Zn/Fe] = + 1.0 in BS 16920-017 (Fig. 3) and Ivans et al. (2003) found almost the same value in CS 22966-043 and G 4-36, both at [Fe/H] ≈ − 2.0. Is SDSS J0929+0238 an extreme case of these Zn-rich stars? Different sources have been suggested to produce high [Zn/Fe] ratios: bright and energetic “hypernovae” (Tominaga et al. 2007), neutrino-driven winds in supernova progenitors (Heger & Woosley 2010) and low metallicity rotating stars (A. Chieffi, priv comm.). Yet none of the above possibilities can simultaneously produce such a high [Zn/Fe] ratio and low [Fe/H] value.
Only seven CEMP-no stars are known to be binaries, including the prototype of the class, CS 22957-027 (Preston & Sneden 2001; Starkenburg et al. 2014; Hansen et al. 2016a). SDSS J0929+0238 is by far the most iron-poor among them and the only one that is suspected to be a triple system. Latham et al. (2002) and Carney et al. (2003) have studied the fraction of binaries among Pop II stars based on data that spanned almost 20 yr, and reached the conclusion that the binary fraction is not different from that found in Pop I stars (Duquennoy & Mayor 1991), with no noticeable difference between dwarfs and giants. A similar conclusion was reached by Hansen et al. (2016a) for radial-velocity measurements spanning eight years, targeting CEMP-no stars.
Our radial velocity data shows that the system is unmistakably a binary or perhaps even a trinary system. One difficulty is that since the peaks in the CCFs are almost of equal strength, it is ambiguous to assign a given velocity to the primary or to the secondary. We have tried several methods to detect a period in the data: the Lomb-Scargle periodogram (Lomb 1976; Scargle 1981), the Lafler-Kinman method (Lafler & Kinman 1965) and direct fitting of all the orbital parameters including period Wichmann et al. (2003). We also attempted direct fitting of the orbit with a Monte Carlo Markov chain method (Koch et al. 2014). This exercise led to several plausible orbits with periods that range from 3 to 482 days. Clearly, the data is too sparse to detect a period or to attempt to derive an orbit. Continued monitoring of this system is extremely important as the data will allow us to constrain the masses of the components and determine whether this is a binary (most likely) or trinary system. This will convey important information about the formation of multiple systems of low-mass stars in the early Galaxy.
Acknowledgments
The project is supported by fondation MERAC. We are grateful to A. Chieffi for providing us with insight into nucleosynthesis at low metallicity. We acknowledge financial support from CNRS-INSU Programme National de Cosmologie et Galaxies and Programme National de Physique Stellaire. This research has made use of the services of the ESO Science Archive Facility. R.S.K. acknowledges support from the European Research Council via the ERC Advanced Grant “STARLIGHT: Formation of the First Stars” (project number 339177). H.G.L., R.S.K., S.G. and N.C. acknowledge financial support from Sonderforschungsbereich SFB 881 “The Milky Way System” (subprojects A4, B1, B2 and B8) of the German Research Foundation (DFG). S.S. is supported by a Marie Curie Fellowship, project 700907.
References
- Beers, T. C., & Christlieb, N. 2005, ARA&A, 43, 531 [NASA ADS] [CrossRef] [Google Scholar]
- Bertaux, J. L., Lallement, R., Ferron, S., Boonne, C., & Bodichon, R. 2014, A&A, 564, A46 [NASA ADS] [CrossRef] [EDP Sciences] [Google Scholar]
- Bonifacio, P., & Caffau, E. 2003, A&A, 399, 1183 [NASA ADS] [CrossRef] [EDP Sciences] [Google Scholar]
- Bonifacio, P., Spite, M., Cayrel, R., et al. 2009, A&A, 501, 519 [NASA ADS] [CrossRef] [EDP Sciences] [Google Scholar]
- Bonifacio, P., Caffau, E., Spite, M., et al. 2015, A&A, 579, A28 [NASA ADS] [CrossRef] [EDP Sciences] [Google Scholar]
- Bouchy, F., & Sophie Team 2006, Tenth Anniversary of 51 Peg-b: Status of and prospects for hot Jupiter studies, 319 [Google Scholar]
- Caffau, E., Ludwig, H.-G., Steffen, M., Freytag, B., & Bonifacio, P. 2011, Sol. Phys., 268, 255 [NASA ADS] [CrossRef] [Google Scholar]
- Caffau, E., Bonifacio, P., François, P., et al. 2012, A&A, 542, A51 [NASA ADS] [CrossRef] [EDP Sciences] [Google Scholar]
- Caffau, E., Bonifacio, P., Sbordone, L., et al. 2013, A&A, 560, A71 [NASA ADS] [CrossRef] [EDP Sciences] [Google Scholar]
- Carney, B. W., Latham, D. W., Stefanik, R. P., Laird, J. B., & Morse, J. A. 2003, AJ, 125, 293 [NASA ADS] [CrossRef] [Google Scholar]
- Cayrel, R. 1988, The Impact of Very High S/N Spectroscopy on Stellar Physics, Proc. 132nd Symp. IAU, eds. G. Cayrel de Strobel, & M. Spite, 132, 345 [Google Scholar]
- Cayrel, R., Depagne, E., Spite, M., et al. 2004, A&A, 416, 1117 [NASA ADS] [CrossRef] [EDP Sciences] [Google Scholar]
- Dekker, H., D’Odorico, S., Kaufer, A., Delabre, B., & Kotzlowski, H. 2000, Proc. SPIE, 4008, 534 [Google Scholar]
- Depagne, E., Hill, V., Spite, M., et al. 2002, A&A, 390, 187 [NASA ADS] [CrossRef] [EDP Sciences] [Google Scholar]
- Duquennoy, A., & Mayor, M. 1991, A&A, 248, 485 [NASA ADS] [Google Scholar]
- Gallagher, A. J., Caffau, E., Bonifacio, P., et al. 2016, A&A, 593, A48 [NASA ADS] [CrossRef] [EDP Sciences] [Google Scholar]
- Gustafsson, B., Edvardsson, B., Eriksson, K., et al. 2008, A&A, 486, 951 [NASA ADS] [CrossRef] [EDP Sciences] [Google Scholar]
- Hansen, T. T., Andersen, J., Nordström, B., et al. 2016a, A&A, 586, A160 [NASA ADS] [CrossRef] [EDP Sciences] [Google Scholar]
- Hansen, T. T., Andersen, J., Nordström, B., et al. 2016b, A&A, 588, A3 [NASA ADS] [CrossRef] [EDP Sciences] [Google Scholar]
- Heger, A., & Woosley, S. E. 2010, ApJ, 724, 341 [NASA ADS] [CrossRef] [Google Scholar]
- Honda, S., Aoki, W., Beers, T. C., & Takada-Hidai, M. 2011, ApJ, 730, 77 [NASA ADS] [CrossRef] [Google Scholar]
- Ivans, I. I., Sneden, C., James, C. R., et al. 2003, ApJ, 592, 906 [NASA ADS] [CrossRef] [Google Scholar]
- Koch, A., Hansen, T., Feltzing, S., & Wilkinson, M. I. 2014, ApJ, 780, 91 [NASA ADS] [CrossRef] [Google Scholar]
- Lafler, J., & Kinman, T. D. 1965, ApJS, 11, 216 [NASA ADS] [CrossRef] [Google Scholar]
- Latham, D. W., Stefanik, R. P., Torres, G., et al. 2002, AJ, 124, 1144 [NASA ADS] [CrossRef] [Google Scholar]
- Lodders, K., Plame, H., & Gail, H.-P. 2009, Landolt-Börnstein − Group VI Astronomy and Astrophysics Numerical Data and Functional Relationships in Science and Technology, Vol. 4B: Solar System. ed. J. E. Trümper, 4.4., 44 [Google Scholar]
- Lomb, N. R. 1976, Ap&SS, 39, 447 [NASA ADS] [CrossRef] [Google Scholar]
- Lucatello, S., Tsangarides, S., Beers, T. C., et al. 2005, ApJ, 625, 825 [NASA ADS] [CrossRef] [Google Scholar]
- Masseron, T., Johnson, J. A., Plez, B., et al. 2010, A&A, 509, A93 [NASA ADS] [CrossRef] [EDP Sciences] [Google Scholar]
- Mishenina, T. V., Pignatari, M., Korotin, S. A., et al. 2013, A&A, 552, A128 [NASA ADS] [CrossRef] [EDP Sciences] [Google Scholar]
- Molaro, P., Levshakov, S. A., Monai, S., et al. 2008, A&A, 481, 559 [NASA ADS] [CrossRef] [EDP Sciences] [Google Scholar]
- Plez, B. 2012, Turbospectrum: Code for spectral synthesis, astrophysics Source Code Library [Google Scholar]
- Perruchot, S., Kohler, D., Bouchy, F., et al. 2008, Proc. SPIE, 7014, 70140J [CrossRef] [Google Scholar]
- Perruchot, S., Bouchy, F., Chazelas, B., et al. 2011, Proc. SPIE, 8151, 815115 [CrossRef] [Google Scholar]
- Preston, G. W., & Sneden, C. 2001, AJ, 122, 1545 [NASA ADS] [CrossRef] [Google Scholar]
- Roederer, I. U., Placco, V. M., & Beers, T. C. 2016, ApJ, 824, L19 [NASA ADS] [CrossRef] [Google Scholar]
- Salvadori, S., Skuladottir, A., & Tolstoy, E. 2015, MNRAS, 454, 1320 [NASA ADS] [CrossRef] [Google Scholar]
- Sbordone, L., Bonifacio, P., Caffau, E., et al. 2010, A&A, 522, A26 [NASA ADS] [CrossRef] [EDP Sciences] [Google Scholar]
- Scargle, J. D. 1981, ApJS, 45, 1 [NASA ADS] [CrossRef] [Google Scholar]
- Spite, M., Caffau, E., Bonifacio, P., et al. 2013, A&A, 552, A107 [NASA ADS] [CrossRef] [EDP Sciences] [Google Scholar]
- Starkenburg, E., Shetrone, M. D., McConnachie, A. W., & Venn, K. A. 2014, MNRAS, 441, 1217 [NASA ADS] [CrossRef] [Google Scholar]
- Thompson, I. B., Ivans, I. I., Bisterzo, S., et al. 2008, ApJ, 677, 556 [NASA ADS] [CrossRef] [Google Scholar]
- Tominaga, N., Umeda, H., & Nomoto, K. 2007, ApJ, 660, 516 [NASA ADS] [CrossRef] [Google Scholar]
- Wichmann, R., Schmitt, J. H. M. M., & Hubrig, S. 2003, A&A, 400, 293 [NASA ADS] [CrossRef] [EDP Sciences] [Google Scholar]
- Yoon, J., Beers, T. C., Placco, V. M., et al. 2016, ApJ, in press [arXiv:1607.06336] [Google Scholar]
Appendix A: Additional data
In Table A.1 we report our measurements of the radial velocities. To verify the robustness of the synthetic spectrum we used as a mask for the cross-correlations, we used it to measure the radial velocity from a SOPHIE (Bouchy & Sophie Team 2006; Perruchot et al. 2008, 2011) spectrum of HD 201891. This star has similar stellar parameters (Teff = 5850 K and log g = 4.40, Mishenina et al. 2013) and its [Fe/H] = − 0.96 makes its G-band of comparable strength to that shown in the spectrum of SDSS J0929+0238. We degraded the SOPHIE spectrum at the resolution of our UVES spectrum. From the cross-correlation we derived a radial velocity of 0.4 km s-1 smaller than the result provided by the SOPHIE pipeline. This tiny difference can be explained by the fact that in the range of the G-band there are also metallic lines that we expect to be present in the spectrum of HD 201891 but not in our mask. We consider the mask appropriate for providing radial velocities to better than 1 km s-1.
In Fig. A.1 we show the spectral range covering the Zn i 481.0528 nm line. A zoom with the best fit is presented in the inset. Formally the line is detected at 3.9σ, but Cayrel’s formula does not take into account the uncertainty in the continuum. In practice, we consider the line to be detected at 3σ and the shift in wavelength makes the identification uncertain. Using the TAPAS service (Bertaux et al. 2014) we verified that there are no telluric absorption lines in the range.
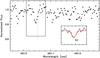 |
Fig. A.1 The spectrum of SDSS J0929+0238 in the range of the Zn i line (solid black). The best fit (solid red) is shown in the inset for the case where log g = 4.5 and assuming the feature is Zn. The vertical black dotted-line shows the laboratory position of the Zn i 481.0528 nm line. |
Radial velocities derived from the G-band for SDSS J0929+0238.
All Tables
All Figures
|
Fig. 1 Upper panel: three representative spectra of SDSS J0929+0238 in the range of Ca ii-K (vertical dotted line) obtained on different dates and smoothed by 10 km s-1. The presence of several stars contributing to the spectra is evident from the clear asymmetry of Ca ii-K (highlighted by the vertical dashed lines) in the spectra corresponding to the multiple peak in the CCF. Lower panel: the corresponding cross-correlation functions. |
| In the text | |
|
Fig. 2 Zinc abundance as a function of metallicity. The measurement for BS 16920-017 is from Honda et al. (2011), that of BD+44° 493 is from Roederer et al. (2016). the open circles are giants (Cayrel et al. 2004), filled circles are dwarfs (Bonifacio et al. 2009), downward arrows are upper limits for dwarfs (Bonifacio et al. 2009). The two red open circles are CEMP-no stars. The red full circle with a question mark is the Zn abundance derived in the case of log g = 4.5 for SDSS J0929+0238. |
| In the text | |
|
Fig. A.1 The spectrum of SDSS J0929+0238 in the range of the Zn i line (solid black). The best fit (solid red) is shown in the inset for the case where log g = 4.5 and assuming the feature is Zn. The vertical black dotted-line shows the laboratory position of the Zn i 481.0528 nm line. |
| In the text | |
Current usage metrics show cumulative count of Article Views (full-text article views including HTML views, PDF and ePub downloads, according to the available data) and Abstracts Views on Vision4Press platform.
Data correspond to usage on the plateform after 2015. The current usage metrics is available 48-96 hours after online publication and is updated daily on week days.
Initial download of the metrics may take a while.