Free Access
Fig. A.1
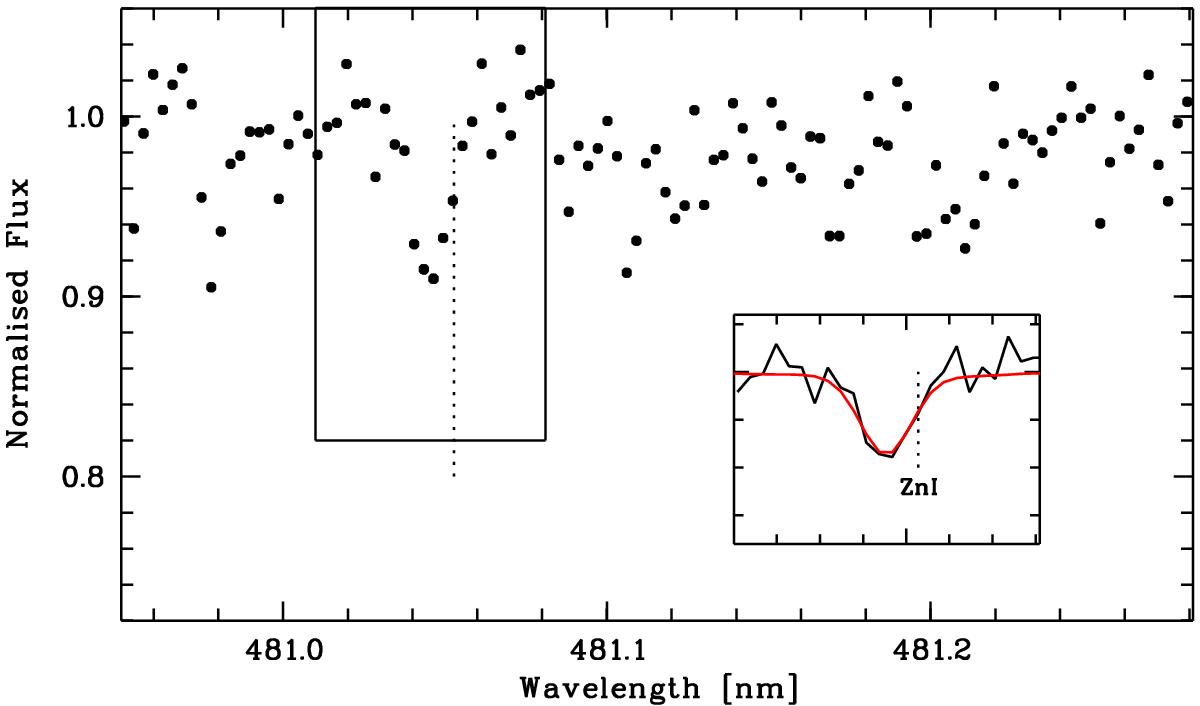
The spectrum of SDSS J0929+0238 in the range of the Zn i line (solid black). The best fit (solid red) is shown in the inset for the case where log g = 4.5 and assuming the feature is Zn. The vertical black dotted-line shows the laboratory position of the Zn i 481.0528 nm line.
Current usage metrics show cumulative count of Article Views (full-text article views including HTML views, PDF and ePub downloads, according to the available data) and Abstracts Views on Vision4Press platform.
Data correspond to usage on the plateform after 2015. The current usage metrics is available 48-96 hours after online publication and is updated daily on week days.
Initial download of the metrics may take a while.