Fig. 7
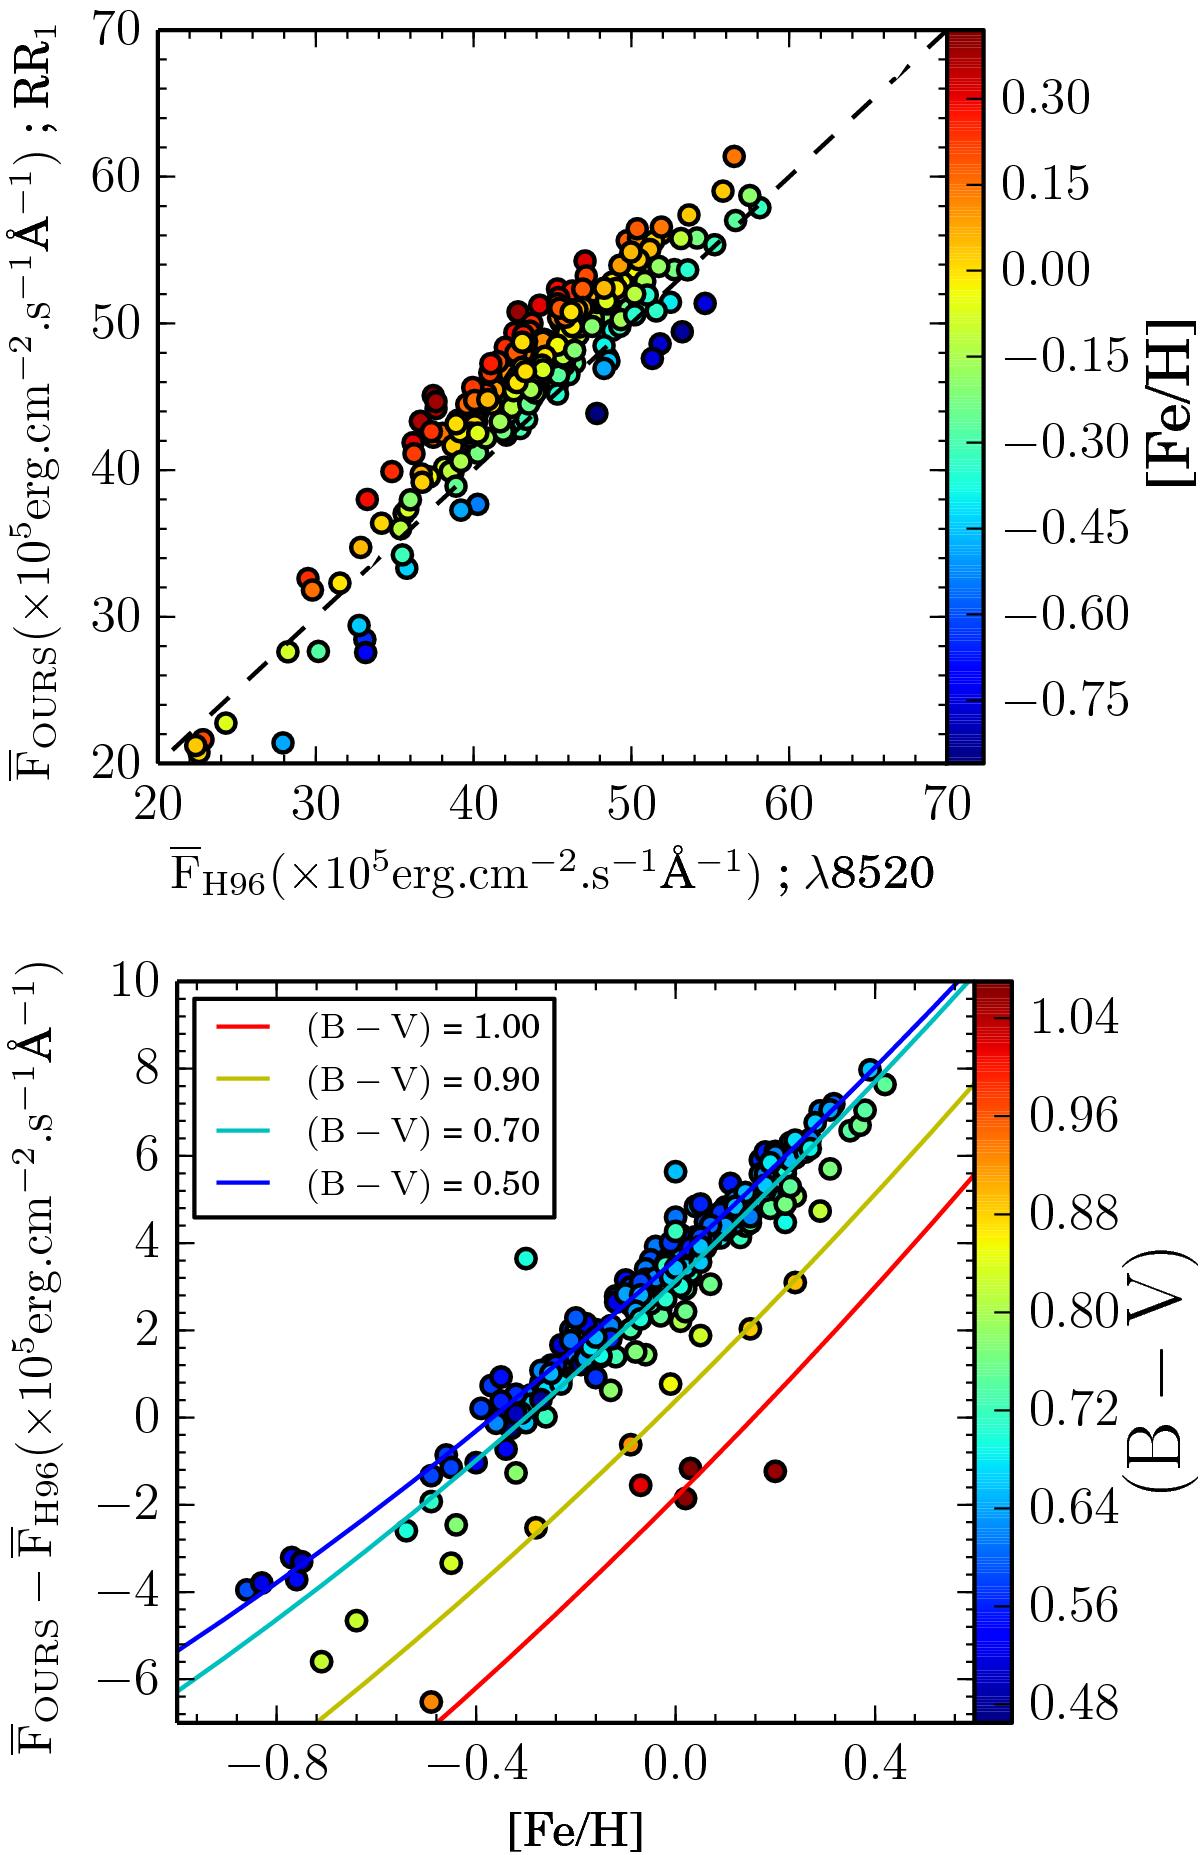
Upper panel: comparison between Hall (1996) and our calibration of near-IR continuum absolute fluxes. Lower panel: strong [Fe/H] correlation in the differences between the absolute continuum flux estimates. The colors are related to different [Fe/H] (upper panel) and (B−V) (lower panel) estimates for each star. The solid lines are correction functions for specific (B−V) indices.
Current usage metrics show cumulative count of Article Views (full-text article views including HTML views, PDF and ePub downloads, according to the available data) and Abstracts Views on Vision4Press platform.
Data correspond to usage on the plateform after 2015. The current usage metrics is available 48-96 hours after online publication and is updated daily on week days.
Initial download of the metrics may take a while.