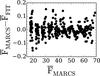
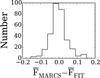
Fig. 5

Distribution (left panel) and histogram (right panel) of RR1 residuals for the cubic fitting model. Left panel: the differences between the NMARCS theoretical fluxes and the fluxes obtained from our regression models as a function of the NMARCS theoretical fluxes. Right panel: the distribution of the residuals from the relation showed in the left panel. The absolute continuum flux is in 105 erg cm-2 s-1 Å-1 units.
Current usage metrics show cumulative count of Article Views (full-text article views including HTML views, PDF and ePub downloads, according to the available data) and Abstracts Views on Vision4Press platform.
Data correspond to usage on the plateform after 2015. The current usage metrics is available 48-96 hours after online publication and is updated daily on week days.
Initial download of the metrics may take a while.