Fig. 12
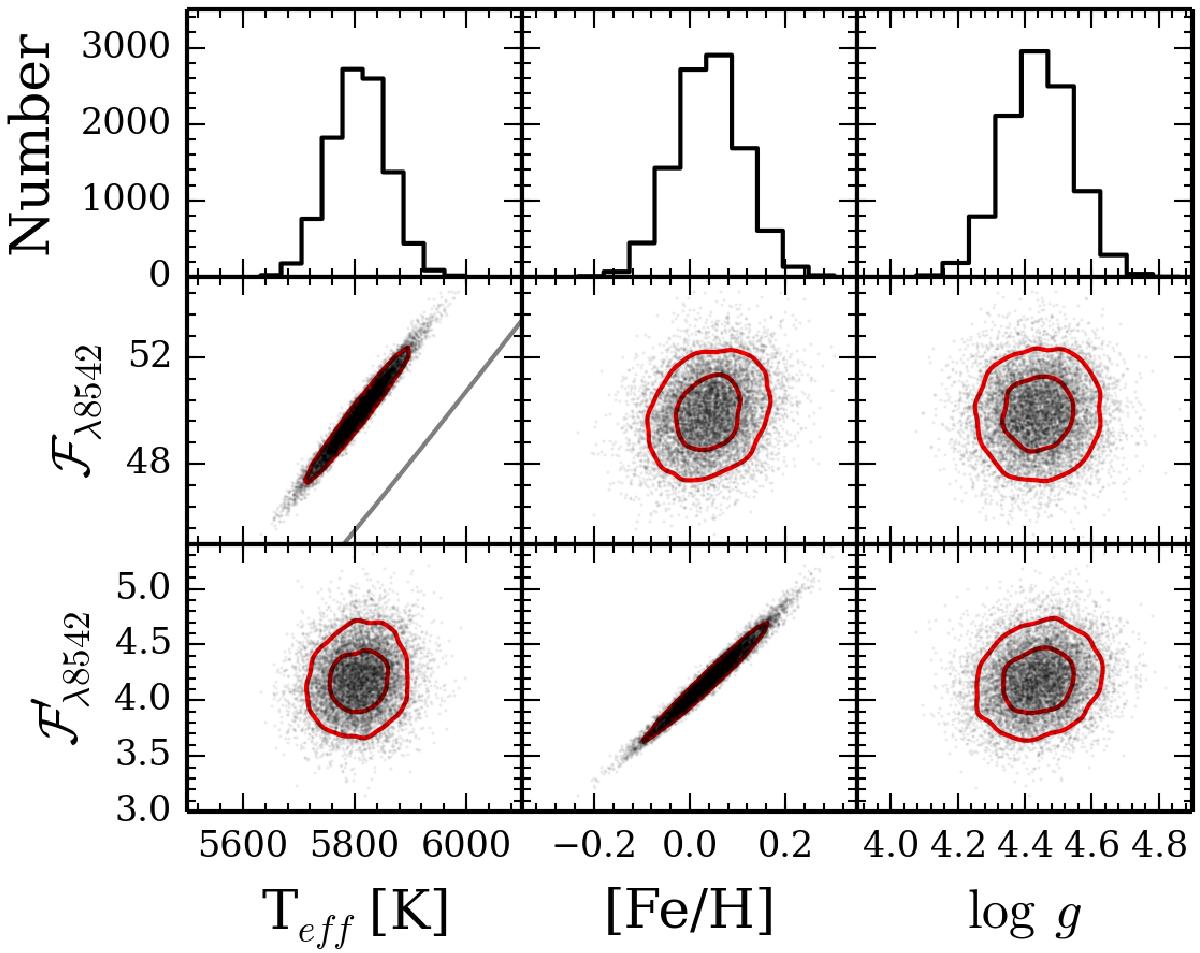
18 Sco MC output distributions of ℱλ8542 and ![]() as a function of Teff, [Fe/H] and log gare shown. Upper panels: we consider input errors of 50 K, 0.1 dex, and 0.07 dex of Teff, [Fe/H], and log g. Middle panels: ℱλ8542 output distribution. Solid gray line refers to the photospheric correction and the solid red lines are 1σ and 2σ confidence intervals. Lower panels:
as a function of Teff, [Fe/H] and log gare shown. Upper panels: we consider input errors of 50 K, 0.1 dex, and 0.07 dex of Teff, [Fe/H], and log g. Middle panels: ℱλ8542 output distribution. Solid gray line refers to the photospheric correction and the solid red lines are 1σ and 2σ confidence intervals. Lower panels: ![]() correlations with atmospheric parameters.
correlations with atmospheric parameters.
Current usage metrics show cumulative count of Article Views (full-text article views including HTML views, PDF and ePub downloads, according to the available data) and Abstracts Views on Vision4Press platform.
Data correspond to usage on the plateform after 2015. The current usage metrics is available 48-96 hours after online publication and is updated daily on week days.
Initial download of the metrics may take a while.