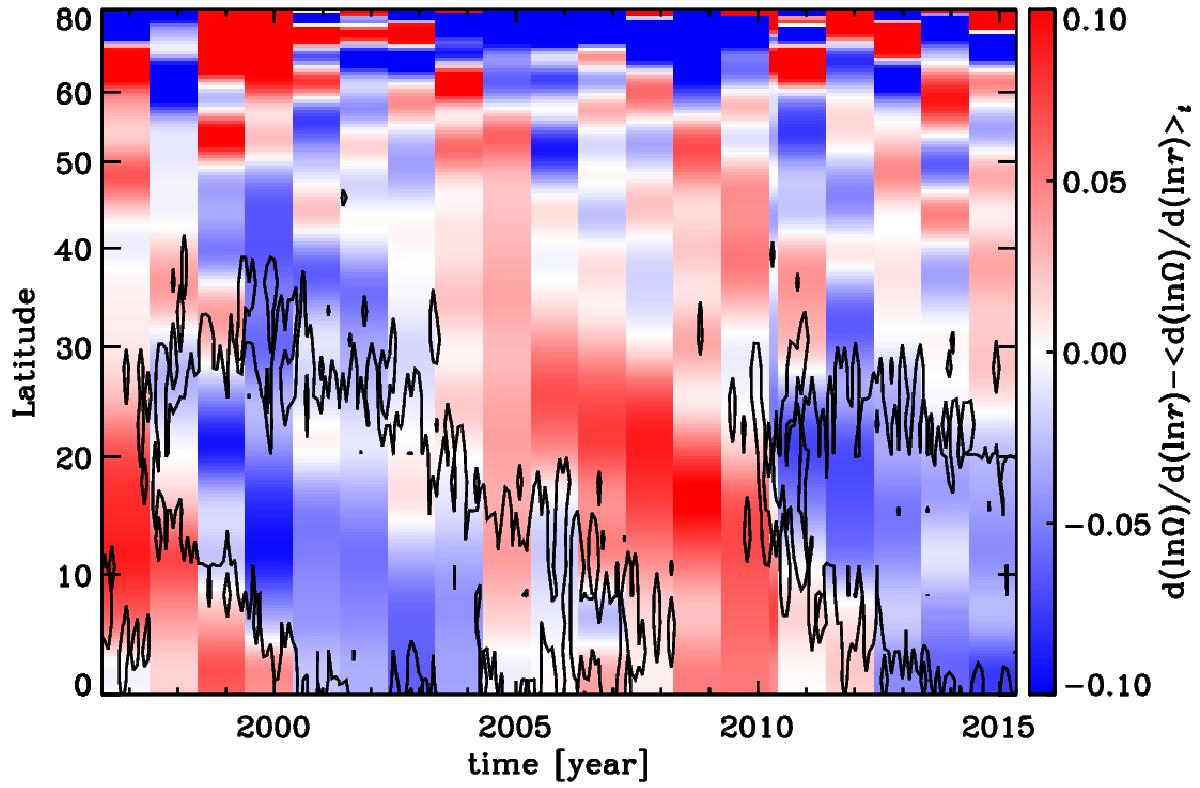
Fig. 4

Time variation of dlnΩ/dlnr relative to its 19 year time average. The thin stripe in the plot shows the result obtained from data set 15 overploted on data set 16 as there is 288 days overlap between these two data sets. The contours show the two hemisphere averaged butterfly diagram of the sunspot area of 5 per millionths of a hemisphere (courtesy of D. Hathaway; see http://solarscience.msfc.nasa.gov/greenwch.shtml).
Current usage metrics show cumulative count of Article Views (full-text article views including HTML views, PDF and ePub downloads, according to the available data) and Abstracts Views on Vision4Press platform.
Data correspond to usage on the plateform after 2015. The current usage metrics is available 48-96 hours after online publication and is updated daily on week days.
Initial download of the metrics may take a while.


