Fig. 1
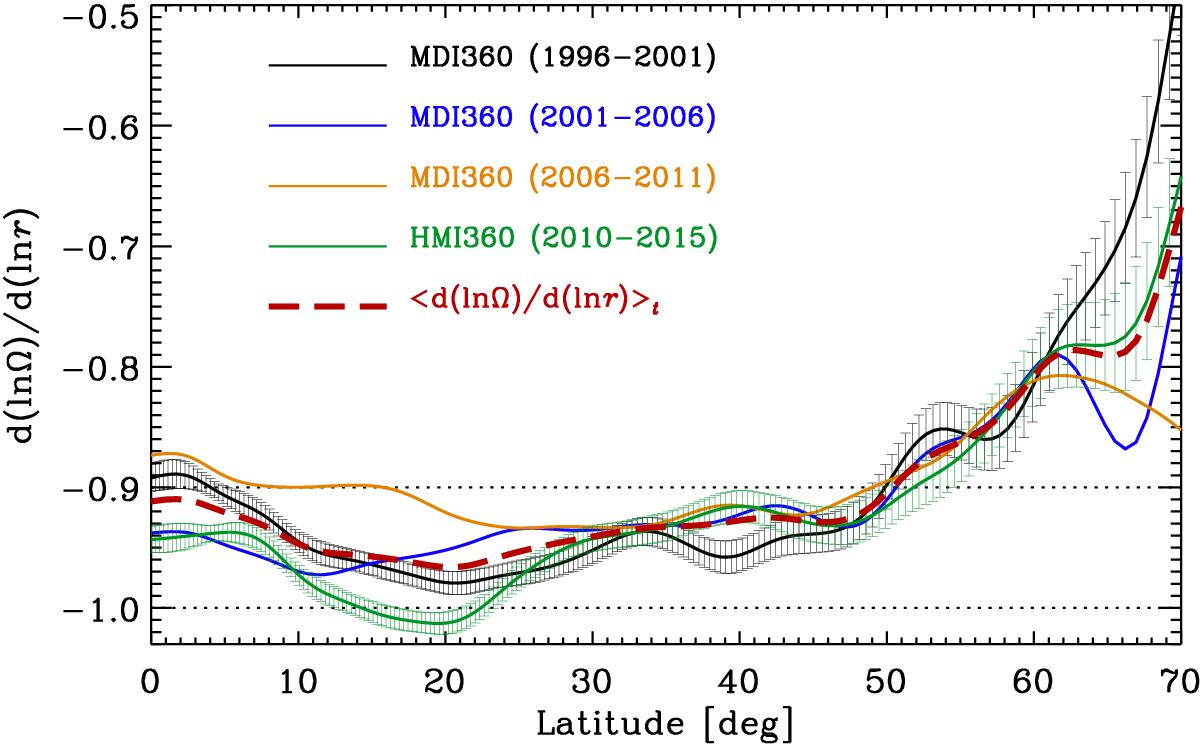
Time average of the logarithmic radial gradient versus target latitude. Black, blue, and orange lines represent each consecutive five year time average of dlnΩ/dlnr obtained from MDI360. The green line shows the same quantity obtained from HMI360. The red dashed line shows the 19 year (1996−2015) time average of dlnΩ/dlnr. The error bars are 1σ. The errors on the orange and blue lines are similar to the black one. The errors on the red dashed line are similar to the thickness of the line.
Current usage metrics show cumulative count of Article Views (full-text article views including HTML views, PDF and ePub downloads, according to the available data) and Abstracts Views on Vision4Press platform.
Data correspond to usage on the plateform after 2015. The current usage metrics is available 48-96 hours after online publication and is updated daily on week days.
Initial download of the metrics may take a while.