Free Access
Fig. 7
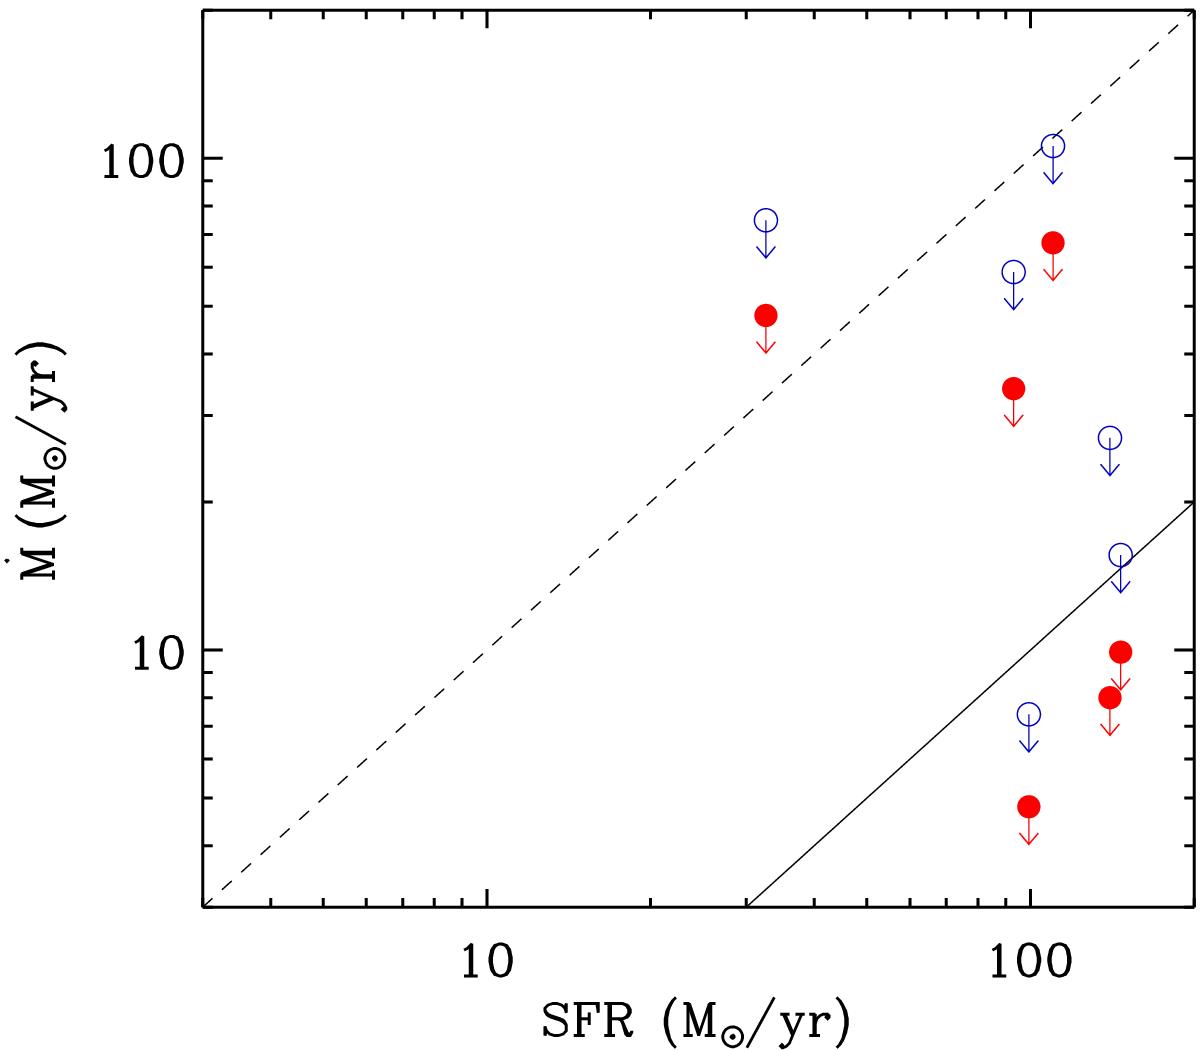
Mass cooling rate vs. SFR. Filled red circles refer to the statistical 95% confidence upper limits on mass cooling rates. Empty blue circles refer to upper limits on cooling rates that include systematic errors. Dashed and solid lines show the relations Ṁ = SFR and Ṁ = 0.1 SFR, respectively.
Current usage metrics show cumulative count of Article Views (full-text article views including HTML views, PDF and ePub downloads, according to the available data) and Abstracts Views on Vision4Press platform.
Data correspond to usage on the plateform after 2015. The current usage metrics is available 48-96 hours after online publication and is updated daily on week days.
Initial download of the metrics may take a while.