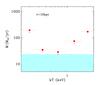
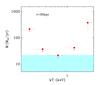
Fig. 1

Measured cooling rate as a function of temperature range. Left: red circles show the values of Ṁ measured in different temperature bins in the inner 10 kpc of A1835. Error bars correspond to 1σ, arrows indicate 95% confidence upper limits. The shaded area is the 1σ uncertainty or the 95% upper limit interval of the global mass cooling rate obtained with a single mkcflow model in the temperature range 0.15−3.0 keV. Right: same as left panel for the inner 20 kpc.
Current usage metrics show cumulative count of Article Views (full-text article views including HTML views, PDF and ePub downloads, according to the available data) and Abstracts Views on Vision4Press platform.
Data correspond to usage on the plateform after 2015. The current usage metrics is available 48-96 hours after online publication and is updated daily on week days.
Initial download of the metrics may take a while.