| Issue |
A&A
Volume 594, October 2016
|
|
|---|---|---|
| Article Number | A74 | |
| Number of page(s) | 7 | |
| Section | Extragalactic astronomy | |
| DOI | https://doi.org/10.1051/0004-6361/201628952 | |
| Published online | 13 October 2016 | |
K band SINFONI spectra of two z ~ 5 submillimeter galaxy systems: upper limits to the unobscured star formation from [O II] optical emission line searches
1 Universidade Federal do Rio Grande do Sul, IF, CP 15051, 91501-970 Porto Alegre RS Brazil
e-mail: This email address is being protected from spambots. You need JavaScript enabled to view it.
2 Centro de Astrobiología (INTA–CSIC), Ctra de Torrejón a Ajalvir, km 4, 28850 Torrejón de Ardoz, Madrid, Spain
3 ASTRO-UAM, UAM, Unidad Asociada CSIC, Spain
Received: 17 May 2016
Accepted: 22 July 2016
Abstract
We present deep SINFONI K-band integral field spectra of two submillimeter galaxy systems (SMG): BR 1202-0725 and J1000+0234, at z = 4.69 and 4.55, respectively. Spectra extracted for each object in the two systems do not show any signature of the [O ii]λλ3726, 29 Å emission-lines, placing upper flux limits of 3.9 and 2.5 × 10⁻¹⁸erg s-1 cm-2for BR 1202-0725 and J1000+0234, respectively. Using the relation between the star formation rate (SFR) and the luminosity of the [O ii] doublet, we estimate unobscured SFR upper limits of ~ 10−15 M⊙ yr-1and ~30−40 M⊙ yr-1for the objects of the two systems, respectively. For the SMGs, these values are at least two orders of magnitude lower than those derived from SED and IR luminosities. The differences on the SFR values would correspond to internal extinction of, at least, 3.4−4.9 and 2.1−3.6 mag in the visual for BR 1202-0725 and J1000+0234 SMGs, respectively. The upper limit for the [O ii]-derived SFR in one of the LAEs (Lyα2) in the BR1202-0725 system is at least one order of magnitude lower than the previous SFR derived from infrared tracers, while both estimates are in good agreement for Lyα1. The lower limits to the internal extinction in these two Lyman-alpha emitters are 0.6 mag and 1.3 mag, respectively. No evidence for [O ii] emission associated with Lyα1 is identified in our data, implying that residuals of the K-band sky emission lines after subtraction in medium-band imaging data could provide the adequate flux.
Key words: galaxies: high-redshift / galaxies: individual: BR 1202 / 0725 / galaxies: individual: J1000+0234 / galaxies: starburst / galaxies: star formation
© ESO, 2016
1. Introduction
Recent studies of galaxies detected at millimeter and submillimeter wavelengths have largely increased our understanding of the formation and evolution of massive galaxies when the Universe was 1−3 Gyr old. Cosmological simulations indicate that massive galaxies can form at high-z via gas-rich mergers, triggering extreme events such as intense star formation and the simultaneous growing of supermassive black holes (SMBHs) close to their maximum (Eddington) accretion rates (Li et al. 2007; Netzer et al. 2014). Submillimeter galaxies (SMGs) play a key role in this scenario, since they represent examples of starburst galaxies (above main sequence) in the distant universe. At such high redshifts (z ~ 5), a large fraction of the star formation activity is enshrouded in dust, most of the bolometric luminosity is radiated into the FIR (40−500 μm) and submillimeter wavelengths and, therefore, the luminosity of galaxies is proportional to the star formation rate (SFR). SMGs observed with Herschel and ALMA (Mor et al. 2012; Vieira et al. 2013; Netzer et al. 2014) have displayed extremely high infrared luminosities (LFIR ≥ 1013L⊙), which implies SFRs of > 103M⊙yr-1. These rates indicate that the bulk of the star formation in these galaxies have timescales of only  Myr.
Myr.
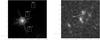 |
Fig. 1 Left panel: HST-NICMOS 2 image of the BR1202-0725 system, using the F160W filter, covering the SINFONI FoV of 8″ × 8″. White crosses indicate the positions of the SMG, quasar, Lyα1 and Lyα2 as labeled, according to Carilli et al. (2013). White squares show the regions where spectra were extracted from the SINFONI datacube. Right panel: HST-WFC3 image of J1000+0234, using the IR channel and F160W filter. White squares show the regions where SMG spectra were extracted from the SINFONI datacube, as identified. The white arrow points to a foreground object. |
The structure and physical mechanisms at work in these objects are largely unknown. Different scenarios have been proposed that imply the removal of the available gas owing to an active galactic nucleus (AGN), driven wind in luminous quasars, or to supernovae and stellar winds in extreme starbursts, leaving behind a compact remnant (Sanders et al. 1988; Hopkins et al. 2008; Wuyts et al. 2010). However, evidence for significant outflow rates at high-z are very limited and have only recently been achieved. One example is the highly magnified galaxy at z = 4.92 behind the lensing cluster MS 1358+62 (Swinbank et al. 2009), in which deep [O ii]λλ3726, 29 Å spectroscopy indicates the presence of a young outflow (<15 Myr) and a SFR of 42M⊙ yr-1.
In this work, we present deep SINFONI–IFS data of two z ~ 5 SMGs, BR 1202-0725 and COSMOS J100054+023436. BR 1202-0725 (z = 4.69) is a system composed of a dusty, luminous starburst (the SMG itself), an optically luminous QSO, and two Lyα-emitting extented regions, hereafter Lyα1 and Lyα2 (Omont et al. 1996; Carilli et al. 2002). The QSO and the SMG are separated by  , with Lyα1 between them (
 north-west of the QSO), a clear signature of interaction, while Lyα2 lies
  south-west of the QSO (see left panel of Fig. 1). Recent observations of the system using ALMA detects narrow [C ii]λ158 μm emission in all four sources (Wagg et al. 2012; Carilli et al. 2013). Both SMG and QSO have high FIR luminosity (LFIR > 1013L⊙) indicating SFRs of the order of 103M⊙ yr-1or above (Iono et al. 2006; Carniani et al. 2013), while both Lyα-emitting regions, Lyα1 and Lyα2, appear to be forming stars, added together, at a rate of 19M⊙ yr-1(Williams et al. 2014), derived from the [C ii] 158 μm emission-line luminosities. Carilli et al. (2013) concluded that the proximity of a luminous quasar is unlikely to be the source of the ionized nebula in Lyα1, and speculate that a optically thick torus is shielding the radiation towards the Lyman-alpha emitters (LAEs, i.e. Lyα1 and Lyα2). Gas outflows related to the QSO are under debate, with some evidence based on the detection of a broad [C ii] secondary component (Carilli et al. 2013), which is not confirmed by similar subsequent studies (Carniani et al. 2013). Ohta et al. (2000) report detection of [O ii] doublet emission of the Lyα1 galaxy based on narrow-band imaging.
COSMOS J100054+023436 (hereafter J1000+0234, z = 4.55) is an SMG dominated by a starburst forming stars at a rate of >1000 M⊙ yr-1with a young age of 2−8 Myr, estimated using infrared and radio measurements (Capak et al. 2008). This SMG presents multiple components observed in the Lyα emission-line, distributed along a region of ≈ 3′′ in size, and residing at the same redshift. This galaxy presents different morphology at different wavelengths, from the UV (Lyα) to the near-infrared (rest-frame optical with [O ii] doublet), which likely indicate the presence of spatially resolved stellar populations on arcsec scales (Capak et al. 2008). Detection of a broad CO(4−3) emission line indicates the presence of a large amount of molecular gas with an estimated total mass of 2.6 × 10¹⁰M⊙. The width of the CO(4−3) line and the highly disturbed morphology suggest this system is involved in an ongoing merger (Schinnerer et al. 2008).
The objective of this work is to search the [O ii]λλ3726 ,29 Å doublet in these two SMGs, to study the structure of the unobscured star formation, including the presence of flows of gas other than rotation. This paper is organized as follows: in Sect. 2, we describe the observations and data reduction, in Sect. 3, we present the results from the SINFONI datacubes for both SMG systems. In Sect. 4, we discuss the implications for the derived star formation rate, internal extinction in the visual, and the claim of previous [O ii] detection in the Lyα1 of the BR1202-0725 system. Finally, conclusions are summarized in Sect. 5. Thoughout this paper we assume a standard concordance cosmology (H0 = 70, ΩM = 0.3, ΩΛ = 0.7).
2. Observations and data reduction
The data were obtained in service mode between January and July 2015 using the near-IR integral field spectrograph SINFONI on the VLT (period 93A). The objects were observed in the K band (1.95−2.45 μm), with each exposure sliced into 32 slitlets imaged onto 64 pixels of the detector, leading to a spatial scale of  pixel-1. We used different observation strategies for the two objects. For BR1202-0725, 15 independent observing blocks (OB), each with an on-source + sky pattern given by the O-S-S-O-O-S sequence were executed. The total on-source exposure time is 3.7 h, and the field of view (FoV) ≈ 10′′ × 8′′. For J1000+0234, two on-source exposures of 600 s each were obtained in 15 OBs (except for one OB where exposures of 300 s were taken), following an O-S-S-O pattern for on-source and sky frames. In this case, since the object is compact and smaller than the field-of-view of SINFONI, the sky exposures were obtained 3″ east of the on-source pointing, thus also containing the object within SINFONI FoV. The resulting total on-source exposure time is then 9.7 h, with a total FoV of ≈ 14′′ × 8′′.
The spectral resolution for the K band is R ~ 3100−3200, and the full width at half maximum (FWHM) measured from the OH sky lines is (6.9 ± 0.3 Å), with a dispersion of 2.45 Å/pixel. Aside from respective sky frame exposures, a set of spectrophotometric standard stars were also observed to correct the data for instrument response and for flux calibration. The reduction process was perfomed using the standard ESO pipeline ESOREX (version 3.10.2), and our own IDL routines for flux calibration. The resulting calibration present flux uncertainties of ≈ 6% (1σ) for the absolute flux, estimated as the standard deviation of the flux factors from the different calibration stars (17 and 14 standard stars observed for BR1202-0725 and J1000+0234, respectively). Individual frames were corrected for dark subtraction, flat-fielding, detector linearity, geometrical distortion, and were wavelength calibrated. We have applied two different methods to address the emission owing to the sky (both lines and thermal continuum). We applied the standard method of subtracting the closest sky frame to each target frame for each OB, and combining the individual sky subtracted cubes per OB into a single final data cube. The results are indicated by the magenta line in Fig. 2 for BR1202-0725. Since the redshifted [O ii] lines were expected to land in between the sky OH lines, an average sky thermal continuum emission was generated with all sky frames. This was subtracted from the final data cube with the spectrum of the object. The end result is represented by the green line in Fig. 2. Since the noise level with this method is somewhat more conservative, i.e. higher noise, we decided to use this method and the corresponding residuals to place more conservative upper limits to the [O ii] flux. Cubes were then constructed from the individual frames, and the several pointings were combined to build a final mosaic, with each spectrum in the cube corresponding to an area of  . To shift and register all individual cubes into a single final data cube, we used the right ascension and declination keywords in the header, since the informed offsets did not match the relative shifts as measured by the position of the QSO (relative shifts of up to
  were measured in a few cases). The accuracy of this procedure is given by the spatial size of a pixel (
 ), since the coordinate information is related to the central pixel of each individual datacube. In the case of BR1202-0725, we also derived a final sky datacube, averaging the individual sky frames. Our seeing-limited observations have an average angular resolution of
  and
and  for BR1202-0725 and J1000+0234, respectively, obtained from observations of the accompanying standard stars and assuming a Gaussian profile.
3. Results
3.1. BR1202-0725
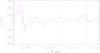 |
Fig. 2 A comparison between the standard sky subtraction applied in the data reduction previous to combining the individual datacubes (magenta line) and the sky subtraction applied after constructing the final datacube (green line), for the SMG of BR1202-0725. The latter method is the one used in this work. The wavelengths of the [O ii] doublet are shown in vertical dashed black lines and dotted vertical lines indicate sky lines. |
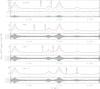 |
Fig. 3 Black lines: integrated spectrum corresponding to the [O ii] doublet range for the quasar, SMG, Lyα1 and Lyα2 (from top to bottom) of the BR1202-0725 system, extracted from the square apertures shown in the left panel of Fig. 1, shifted by a constant (2 × 10-16erg s-1 cm-2 Å-1), added for visual purposes. Red lines: sky spectra, which were derived as the median of the sky spectra, extracted from the same apertures shown in Fig. 1. Green lines show the residual between object and sky spectra and 1σ uncertainty of the sky spectra are displayed in blue lines. Gray shaded areas display the 5σ level. The wavelengths of the [O ii] doublet related to [C ii] redshifts (Carilli et al. 2013) are shown in vertical dashed black lines. Dash-dotted lines show the wavelengths from Lyα redshifts (Ohyama et al. 2004) for Lyα1 (see Table 1). Dotted vertical lines indicate sky lines. |
The entire system, consisting of the SMG, a QSO, and two Lyα emitters, is shown in the left panel of Fig. 1. The figure displays a HST-NICMOS 2 image in the F160W filter (central wavelength of 1.60 μm) of the BR1202-0725 system within the same FoV of SINFONI, along with the positions of the four components of the system, indicated by a white cross, except for the quasar, which is clearly visible. The positions were obtained from Carilli et al. (2013), based on submillimeter continuum measurements, with the exception of Lyα1, where the peak of the [C ii] line emission was used. The SMG and the Lyα emitters are not detected in this image. White squares correspond to  apertures where spectra were extrated from the SINFONI data cube. The size of the apertures matches the seeing (FWHM).
The resulting extracted spectra are displayed in Fig. 3. The corresponding flux limits for the two [O ii] lines of the doublet are given in Table 1 for the different components of the BR1202-0725 system assuming redshifts given by the [C ii]158 μm lines. To estimate the fluxes given in Table 1, we assumed that the emission lines were unresolved at the spectral resolution provided by SINFONI, and therefore considered a width of 6.9 Å (FWHM). For Lyα1 flux estimates, we assume the [O ii] in emission is at the redshift of the Lyα line. The spectra of the SMG and LAEs in the BR 1202-0725 field display no evidence of [O ii] in emission above the (5σ) sky background uncertainties with upper limits ~ 0.8−1.5 × 10⁻¹⁷erg s-1 cm-2for the combined flux of the doublet. The only clear features in the spectra of the objects are the sky lines identified by blue dotted lines. For the QSO associated with the system, there is a significant detection of the continuum but no evidence of the [O ii] emission line, given the upper flux limit that corresponds to ~9 × 10-17erg s-1 cm-2.
3.2. J1000+0234
The near-infrared structure of J1000+0234 is presented in the right panel of Fig. 1 in a F160W HST-WFC3 image, centered on the brightest region and covering the same FoV as our SINFONI integral field data. Fainter structures to the south-west and north-west appear within 1−2 arcsec. A foreground object (z = 1.41) is observed to the west of the SMG, as noted by Capak et al. (2008, white arrow). White squares correspond to  apertures, which match our observational seeing (FWHM), where spectra were extracted. To optimize the signal from the SMG, the fluxes from the two regions identified as SMG have been combined. These are the brightest regions identified in the HST-WFC3 image and where the emission from the [O ii] would be expected in the K-band. Since the final SINFONI datacube was built using object and sky expositions, we establish the flux that is due to the sky emission (and its uncertainty) as the median value of the spaxels in six different extraction regions that are located outside the overall structure of J1000+0234 and avoiding other possibly related features in the field. These regions have the same aperture size as the white squares in Fig. 1.
The combined integrated spectrum of J1000+0234, extracted from the two apertures identified as SMG in Fig. 1, is displayed in Fig. 4. Again there is no evidence of [O ii] emission lines, with no emission above the (5σ) sky uncertainties, and the sky lines are the only clear features present. The upper limits for the flux of the [O ii] doublet is in the ~ 2.8−3.8 × 10⁻¹⁷erg s-1 cm-2range, depending on the redshift and line used (see Table 1 for details).
4. Discussions
4.1. Star formation rates
We estimated the SFRs following the relation from Kennicutt (1998): ![Mathematical equation: \begin{equation} \textit{SFR} (M_\odot\, {\rm yr}^{-1}) = (1.4 \pm 0.4) \times 10^{-41} L_{\textrm{[O\,{\sc ii}] }} (\textrm{erg s}^{-1}), \end{equation}](/articles/aa/full_html/2016/10/aa28952-16/aa28952-16-eq80.png) (1)which make use of a Salpeter initial mass function (IMF) with solar abundances. Table 2 displays the upper limits of L[O ii] and SFRs uncorrected from extinction for the objects of the two SMG systems, taking into consideration the redshifts mentioned in Table 1 (lines used to measure the redshift are in parenthesis). Two approaches are shown: one using both of the [Oii] emission lines to estimate its luminosity, and another using the emission line less affected by the sky lines (thus with lower flux) to estimate the other, taking into consideration a line ratio of [Oii]3729/3726 = 1 (assuming a T ≈ 15 000 K and log ne = 2.5)1.
(1)which make use of a Salpeter initial mass function (IMF) with solar abundances. Table 2 displays the upper limits of L[O ii] and SFRs uncorrected from extinction for the objects of the two SMG systems, taking into consideration the redshifts mentioned in Table 1 (lines used to measure the redshift are in parenthesis). Two approaches are shown: one using both of the [Oii] emission lines to estimate its luminosity, and another using the emission line less affected by the sky lines (thus with lower flux) to estimate the other, taking into consideration a line ratio of [Oii]3729/3726 = 1 (assuming a T ≈ 15 000 K and log ne = 2.5)1.
Redshifts and measured fluxes for the objects of the BR1202-0725 and J1000+0234 systems.
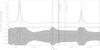 |
Fig. 4 Black line: integrated spectrum of J1000+0234 SMG, extracted inside the white squares shown in right panel of Fig. 1, added by a constant (2 × 10-16erg s-1 cm-2 Å-1), for visual purposes. Red line: Sky spectra, which were derived as the median of the sky spectrum extracted from six different extraction regions located outside the overall structure of J1000+0234. Green line shows the residual between object and sky spectra and 1σ uncertainty of the sky spectrum is displayed with a blue line. Gray shaded area displays the 5σ level. [O ii] doublet wavelengths using redshifts from Lyα and 12CO(4−3) emission-lines are represented by dashed and dot-dashed vertical black lines, respectively (Capak et al. 2008; Schinnerer et al. 2008, see Table 1). Dotted vertical lines correspond to sky line wavelengths. |
We find upper limits for the SFR rates of about 10−15 M⊙ yr-1for the different components of the BR 1202-0725 system, and in the ~30−40 M⊙ yr-1range for J1000+0234. For the two SMGs, these SFR values are about two orders of magnitude lower than those derived from previous measurements, including mid-, far-IR, and radio tracers. This clearly indicates that the amount of unobscured star formation in these systems, as traced by the [O ii] in emission, is extremely low compared with the overall star formation. For Lyα2, we find SFRs of about one order of magnitude lower than those derived from Carilli et al. (2013), using the FIR luminosity and the [C ii] 158 μm line emission measurements. However, for Lyα1, we find SFR upper limits that are in agreement with most of the estimates based on infrared tracers (see Table 2), indicating therefore that this system is less affected by internal dust extinction and is likely to have intrinsically low visual extinction values.
Assuming internal extinction plays the main role in explaining the differences between our [O ii]-derived SFR and those derived from the infrared, in the following section we estimate the average visual extinction in the two SMGs and the two LAEs of BR1202-0725.
Derived upper limits for the [O ii] luminosities and corresponding SFR.
4.2. Internal extinction within the systems
As already mentioned in the previous section, the most probable reason for the non-detection of the [Oii] emission-lines and estimated low SFR upper limits, compared with previous SFR values, is extinction owing to dust absorption in the SMGs. SFRs of 2000−7000 M⊙ yr-1and 1000−4000 M⊙ yr-1for BR1202-0725 and J1000+0234 SMGs would translate into L[O ii] of 1.4−5.0 × 1044erg s-1and 0.7−2.9 × 1044erg s-1, respectively, using the same Kennicutt (1998) relation. Using the upper limits for the luminosities we estimate from the [O ii] emission line less affected by the sky (fourth column in Table 2), the ratio of the [O ii]-derived to IR-derived [O ii] luminosities imply an extinction of at least A[Oii] ≥ 5.7−7.1 mag and 3.5−5.2 mag, for BR1202-0725 and J1000+0234 SMGs respectively. The resulting visual internal extinction is AV ≥ 3.4−4.3 mag and 2.1−3.1 mag for an SMC reddening law (Gordon et al. 2003), or AV ≥ 3.9−4.9 and 2.4−3.6 mag for a starburst reddening law (Calzetti et al. 2000), for BR1202-0725 and J1000+0234 SMGs, respectively. These extinction values are comparable with the ones found in a low-z sample of U/LIRGS, measured over sizes of a few to several kpc (Piqueras López et al. 2013), which is in agreement with other studies that find evidence that these objects are local counterparts of high-z SMGs (Nesvadba et al. 2007; Menéndez-Delmestre et al. 2013).
In the cases of the two LAEs of the BR1202-0725 system, Lyα1 and Lyα2, previous SFR values cover the 13−54 M⊙ yr-1and 70−170 M⊙ yr-1ranges (see Table 2), corresponding to luminosity upper limits of L[Oii] ≈ 0.9−3.8 × 1042erg s-1and 5.0−12.1 × 1042erg s-1, respectively. The internal extincion in the visual is AV(SMC) ≥ 0.2−0.9 mag and 0.9−1.5 mag, or AV(starburst) ≥ 0.2−1.0 mag and 1.1−1.7 mag, for Lyα1 and Lyα2, respectively. We emphasize that the values of extinction in magnitudes that we obtain are lower limits, since they were derived from flux upper limits, as show in Table 1.
4.3. BR1202-0725: [O II] emission associated to Lyα1?
Ohta et al. (2000) reported [O ii]3727 emission in a north-west companion of the quasar in BR1202-0725. This companion is located  northwest of the quasar, so probably relates to the object labeled as Lyα1 here. Using a Cassegrain infrared camera (CISCO) attached to the Subaru Telescope, they obtained narrow-band imaging with a filter centered at 2.1196 μm with a FWHM of 0.0199 μm (the authors report a transmission between 2.113 μm and 2.126 μm ranging from 80% to 88%). The authors estimate a line flux of 2.5 × 10⁻¹⁷erg s-1 cm-2within a circular aperture of
  radius, with a continuum level ten times lower.
According to our results, i.e. upper limit of 0.8 to 1.5 × 10⁻¹⁷erg s-1 cm-2for the [O ii] emission, we hypothesize that the flux reported by Ohta and collaborators could likely be the result of a non-optimal sky subtraction, producing a positive residual that is interpreted as [O ii] in emission. To test this hypothesis, we took a square aperture with a  on a side, centered on Lyα1, and integrated the residual spectrum over the entire spectral window from 2.113 μm to 2.126 μm. We obtain an integrated flux of 2.9 ± 0.2 × 10⁻¹⁷erg s-1 cm-2, in fair agreement with the value reported by Ohta et al. (2000). The same kind of measurements were repeated at different positions within the SINFONI field of view, getting similar flux levels, within the 5σ uncertainties. This supports the hypothesis of residual sky lines as the source of spurious emission. The residuals are likely due to two strong sky emission-lines, at ≈ λ2.1177 and ≈ λ2.125 μm (and another one, fainter, at ≈ λ2.1232 μm), which lay within the filter passband (Fig. 3).
5. Conclusions
In this work we presented deep SINFONI K-band integral field spectroscopy of two SMG systems at z ~ 5, BR1202-0725 and J1000+0234. BR1202-0725 consists of the SMG, a QSO and two LAEs, while J1000+0234 appears to have a complex extended structure, as traced by multiband optical and near-infrared imaging. Our main conclusions are:
-
The spectra extracted for all the objects, including the two LAEs,do not show any signature of the [O ii] doubletwithin the 5σ sky uncertainties. The corresponding upper limits for the SFR in the two SMGs are two orders of magnitude below those derived from far-infrared measurements. The differences are explained as being due to internal obscuration equivalent to an average visual internal extinction of, at least, 4.1 mag and 2.8 mag for BR1202-0725 and J1000+0234, respectively. These average high internal extinctions are similar to those measured in low-z U/LIRGs.
-
The SFR upper limit for Lyα2 derived from the non-detection of the [O ii] is at least one order of magnitude lower than that measured from the infrared, while the corresponding values for Lyα1 are in fairly good agreement, suggesting a very low internal extinction in this LAE. We find an internal extinction of at least 0.6 and 1.3 mag in the visual for Lyα1 and Lyα2, respectively.
-
Previous claims of [O ii] emission associated with BR1202-0725 Lyα1 based on narrow-band imaging are not confirmed by our SINFONI 2D spectroscopy. Residuals due to some of the sky emission lines within the filter bandpass could produce fluxes compatible with the [O ii] flux reported previously by Ohta et al. (2000).
SFRs should be multiplied by 0.6−0.7 if applying another IMF such as Kroupa (2001) or Chabrier (2005) (Madau & Dickinson 2014).
Acknowledgments
G.S.C. and L.C. acknowledge support from CNPq special visitor fellowship PVE 313945/2013-6 under the Brazilian program Science without Borders. L.C. acknowledges support by grant AYA2012-32295. J.P.L. acknowledges support by grant AYA-2012-39408-C02-1. L.C. acknowledges support by grant AYA2012-39408-C02-01 and AYA2015-68964. Based on observations collected at the European Organisation for Astronomical Research in the Southern Hemisphere, Chile, programm 093.A-0204A. Some of the data presented in this paper were obtained from the Multimission Archive at the Space Telescope Science Institute (MAST). G.S.C. wants to thank Natacha Z. Dametto for fruitful discussions and assistance.
References
- Calzetti, D., Armus, L., Bohlin, R. C., et al. 2000, ApJ, 533, 682 [NASA ADS] [CrossRef] [Google Scholar]
- Capak, P., Carilli, C. L., Lee, N., et al. 2008, ApJ, 681, L53 [Google Scholar]
- Carilli, C. L., Kohno, K., Kawabe, R., et al. 2002, AJ, 123, 1838 [NASA ADS] [CrossRef] [Google Scholar]
- Carilli, C. L., Riechers, D., Walter, F., et al. 2013, ApJ, 763, 120 [NASA ADS] [CrossRef] [Google Scholar]
- Carniani, S., Marconi, A., Biggs, A., et al. 2013, A&A, 559, A29 [NASA ADS] [CrossRef] [EDP Sciences] [Google Scholar]
- Chabrier, G. 2005, in The Initial Mass Function 50 Years Later, eds. E. Corbelli, F. Palla, & H. Zinnecker, Astrophys. Space Sci. Lib., 327, 41 [Google Scholar]
- Fontana, A., D’Odorico, S., Giallongo, E., et al. 1998, AJ, 115, 1225 [NASA ADS] [CrossRef] [Google Scholar]
- Gordon, K. D., Clayton, G. C., Misselt, K. A., Landolt, A. U., & Wolff, M. J. 2003, ApJ, 594, 279 [NASA ADS] [CrossRef] [EDP Sciences] [Google Scholar]
- Hopkins, P. F., Hernquist, L., Cox, T. J., & Kereš, D. 2008, ApJS, 175, 356 [NASA ADS] [CrossRef] [Google Scholar]
- Iono, D., Yun, M. S., Elvis, M., et al. 2006, ApJ, 645, L97 [NASA ADS] [CrossRef] [Google Scholar]
- Kennicutt, Jr., R. C. 1998, ARA&A, 36, 189 [Google Scholar]
- Kroupa, P. 2001, MNRAS, 322, 231 [NASA ADS] [CrossRef] [Google Scholar]
- Li, Y., Hernquist, L., Robertson, B., et al. 2007, ApJ, 665, 187 [NASA ADS] [CrossRef] [Google Scholar]
- Madau, P., & Dickinson, M. 2014, ARA&A, 52, 415 [NASA ADS] [CrossRef] [Google Scholar]
- Menéndez-Delmestre, K., Blain, A. W., Swinbank, M., et al. 2013, ApJ, 767, 151 [NASA ADS] [CrossRef] [Google Scholar]
- Mor, R., Netzer, H., Trakhtenbrot, B., Shemmer, O., & Lira, P. 2012, ApJ, 749, L25 [NASA ADS] [CrossRef] [Google Scholar]
- Nesvadba, N. P. H., Lehnert, M. D., Genzel, R., et al. 2007, ApJ, 657, 725 [NASA ADS] [CrossRef] [Google Scholar]
- Netzer, H., Mor, R., Trakhtenbrot, B., Shemmer, O., & Lira, P. 2014, ApJ, 791, 34 [NASA ADS] [CrossRef] [Google Scholar]
- Ohta, K., Matsumoto, T., Maihara, T., et al. 2000, PASJ, 52, 557 [NASA ADS] [CrossRef] [Google Scholar]
- Ohyama, Y., Taniguchi, Y., & Shioya, Y. 2004, AJ, 128, 2704 [NASA ADS] [CrossRef] [Google Scholar]
- Omont, A., Petitjean, P., Guilloteau, S., et al. 1996, Nature, 382, 428 [NASA ADS] [CrossRef] [PubMed] [Google Scholar]
- Piqueras López, J., Colina, L., Arribas, S., & Alonso-Herrero, A. 2013, A&A, 553, A85 [NASA ADS] [CrossRef] [EDP Sciences] [Google Scholar]
- Salomé, P., Guélin, M., Downes, D., et al. 2012, A&A, 545, A57 [NASA ADS] [CrossRef] [EDP Sciences] [Google Scholar]
- Sanders, D. B., Soifer, B. T., Elias, J. H., Neugebauer, G., & Matthews, K. 1988, ApJ, 328, L35 [NASA ADS] [CrossRef] [Google Scholar]
- Schinnerer, E., Carilli, C. L., Capak, P., et al. 2008, ApJ, 689, L5 [Google Scholar]
- Swinbank, A. M., Webb, T. M., Richard, J., et al. 2009, MNRAS, 400, 1121 [NASA ADS] [CrossRef] [Google Scholar]
- Vieira, J. D., Marrone, D. P., Chapman, S. C., et al. 2013, Nature, 495, 344 [NASA ADS] [CrossRef] [Google Scholar]
- Wagg, J., Wiklind, T., Carilli, C. L., et al. 2012, ApJ, 752, L30 [NASA ADS] [CrossRef] [Google Scholar]
- Williams, R. J., Wagg, J., Maiolino, R., et al. 2014, MNRAS, 439, 2096 [NASA ADS] [CrossRef] [Google Scholar]
- Wuyts, S., Cox, T. J., Hayward, C. C., et al. 2010, ApJ, 722, 1666 [NASA ADS] [CrossRef] [Google Scholar]
All Tables
Redshifts and measured fluxes for the objects of the BR1202-0725 and J1000+0234 systems.
All Figures
|
Fig. 1 Left panel: HST-NICMOS 2 image of the BR1202-0725 system, using the F160W filter, covering the SINFONI FoV of 8″ × 8″. White crosses indicate the positions of the SMG, quasar, Lyα1 and Lyα2 as labeled, according to Carilli et al. (2013). White squares show the regions where spectra were extracted from the SINFONI datacube. Right panel: HST-WFC3 image of J1000+0234, using the IR channel and F160W filter. White squares show the regions where SMG spectra were extracted from the SINFONI datacube, as identified. The white arrow points to a foreground object. |
| In the text | |
|
Fig. 2 A comparison between the standard sky subtraction applied in the data reduction previous to combining the individual datacubes (magenta line) and the sky subtraction applied after constructing the final datacube (green line), for the SMG of BR1202-0725. The latter method is the one used in this work. The wavelengths of the [O ii] doublet are shown in vertical dashed black lines and dotted vertical lines indicate sky lines. |
| In the text | |
|
Fig. 3 Black lines: integrated spectrum corresponding to the [O ii] doublet range for the quasar, SMG, Lyα1 and Lyα2 (from top to bottom) of the BR1202-0725 system, extracted from the square apertures shown in the left panel of Fig. 1, shifted by a constant (2 × 10-16erg s-1 cm-2 Å-1), added for visual purposes. Red lines: sky spectra, which were derived as the median of the sky spectra, extracted from the same apertures shown in Fig. 1. Green lines show the residual between object and sky spectra and 1σ uncertainty of the sky spectra are displayed in blue lines. Gray shaded areas display the 5σ level. The wavelengths of the [O ii] doublet related to [C ii] redshifts (Carilli et al. 2013) are shown in vertical dashed black lines. Dash-dotted lines show the wavelengths from Lyα redshifts (Ohyama et al. 2004) for Lyα1 (see Table 1). Dotted vertical lines indicate sky lines. |
| In the text | |
|
Fig. 4 Black line: integrated spectrum of J1000+0234 SMG, extracted inside the white squares shown in right panel of Fig. 1, added by a constant (2 × 10-16erg s-1 cm-2 Å-1), for visual purposes. Red line: Sky spectra, which were derived as the median of the sky spectrum extracted from six different extraction regions located outside the overall structure of J1000+0234. Green line shows the residual between object and sky spectra and 1σ uncertainty of the sky spectrum is displayed with a blue line. Gray shaded area displays the 5σ level. [O ii] doublet wavelengths using redshifts from Lyα and 12CO(4−3) emission-lines are represented by dashed and dot-dashed vertical black lines, respectively (Capak et al. 2008; Schinnerer et al. 2008, see Table 1). Dotted vertical lines correspond to sky line wavelengths. |
| In the text | |
Current usage metrics show cumulative count of Article Views (full-text article views including HTML views, PDF and ePub downloads, according to the available data) and Abstracts Views on Vision4Press platform.
Data correspond to usage on the plateform after 2015. The current usage metrics is available 48-96 hours after online publication and is updated daily on week days.
Initial download of the metrics may take a while.