Fig. 3
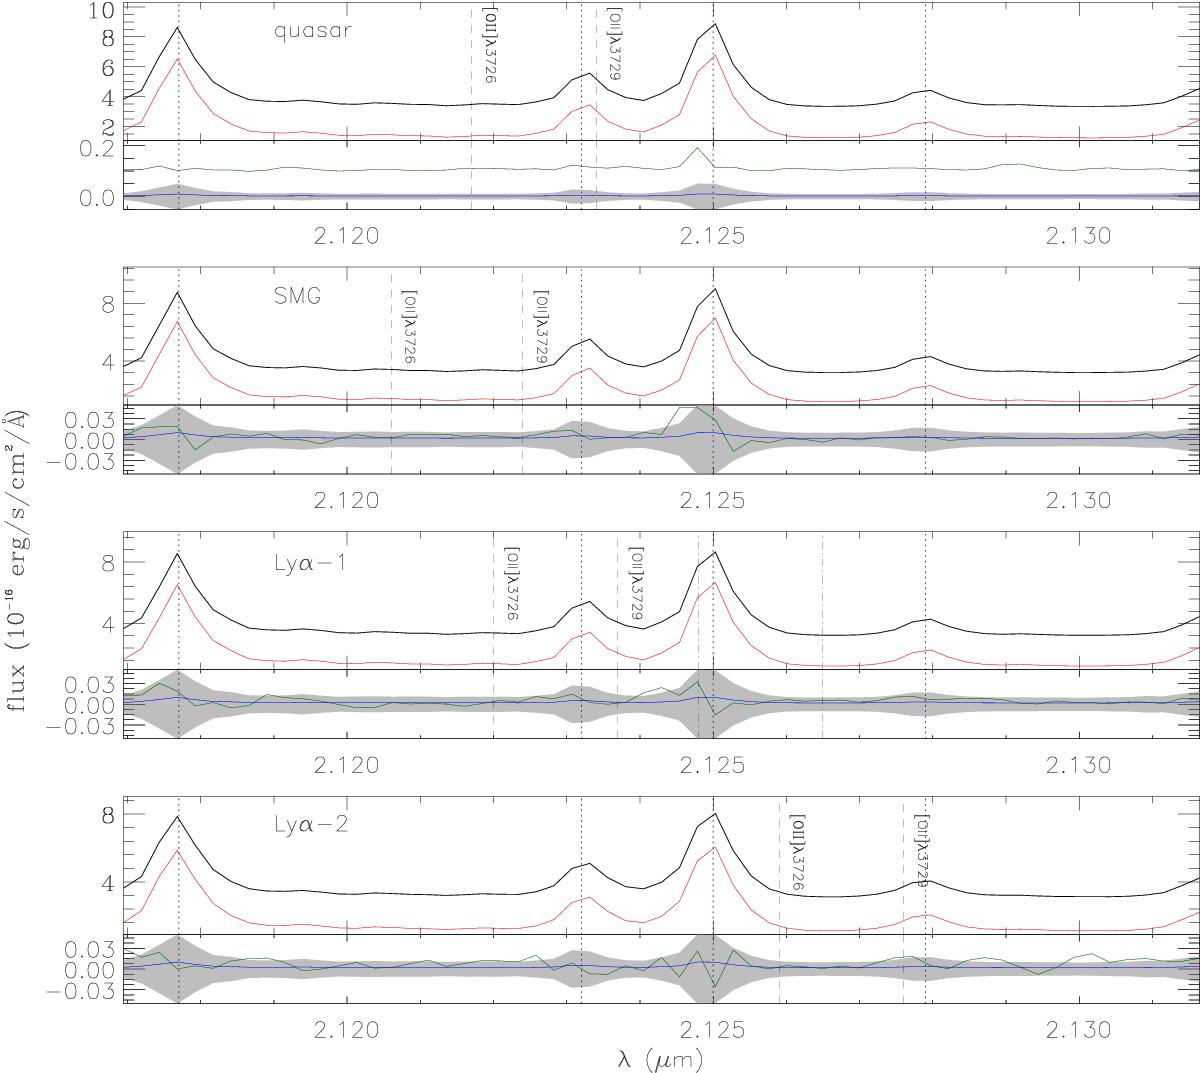
Black lines: integrated spectrum corresponding to the [O ii] doublet range for the quasar, SMG, Lyα1 and Lyα2 (from top to bottom) of the BR1202-0725 system, extracted from the square apertures shown in the left panel of Fig. 1, shifted by a constant (2 × 10-16erg s-1 cm-2 Å-1), added for visual purposes. Red lines: sky spectra, which were derived as the median of the sky spectra, extracted from the same apertures shown in Fig. 1. Green lines show the residual between object and sky spectra and 1σ uncertainty of the sky spectra are displayed in blue lines. Gray shaded areas display the 5σ level. The wavelengths of the [O ii] doublet related to [C ii] redshifts (Carilli et al. 2013) are shown in vertical dashed black lines. Dash-dotted lines show the wavelengths from Lyα redshifts (Ohyama et al. 2004) for Lyα1 (see Table 1). Dotted vertical lines indicate sky lines.
Current usage metrics show cumulative count of Article Views (full-text article views including HTML views, PDF and ePub downloads, according to the available data) and Abstracts Views on Vision4Press platform.
Data correspond to usage on the plateform after 2015. The current usage metrics is available 48-96 hours after online publication and is updated daily on week days.
Initial download of the metrics may take a while.