Fig. 1
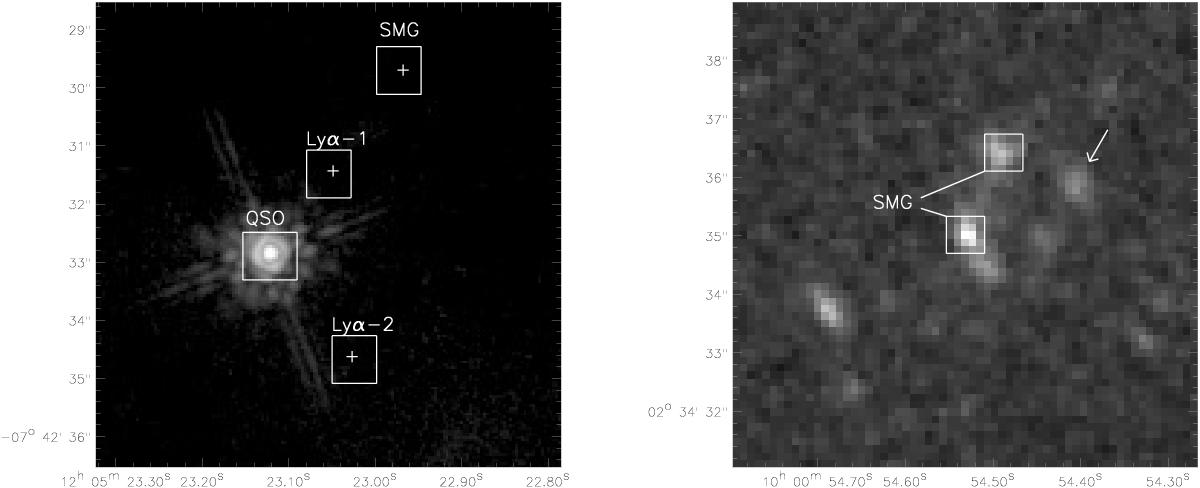
Left panel: HST-NICMOS 2 image of the BR1202-0725 system, using the F160W filter, covering the SINFONI FoV of 8″ × 8″. White crosses indicate the positions of the SMG, quasar, Lyα1 and Lyα2 as labeled, according to Carilli et al. (2013). White squares show the regions where spectra were extracted from the SINFONI datacube. Right panel: HST-WFC3 image of J1000+0234, using the IR channel and F160W filter. White squares show the regions where SMG spectra were extracted from the SINFONI datacube, as identified. The white arrow points to a foreground object.
Current usage metrics show cumulative count of Article Views (full-text article views including HTML views, PDF and ePub downloads, according to the available data) and Abstracts Views on Vision4Press platform.
Data correspond to usage on the plateform after 2015. The current usage metrics is available 48-96 hours after online publication and is updated daily on week days.
Initial download of the metrics may take a while.