Fig. 4
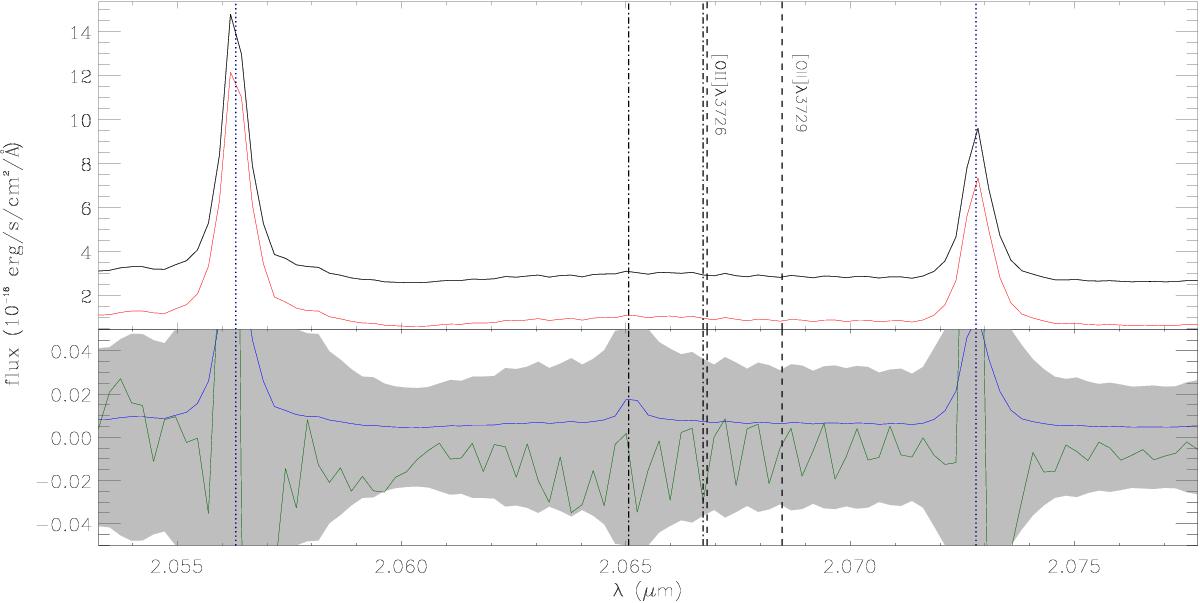
Black line: integrated spectrum of J1000+0234 SMG, extracted inside the white squares shown in right panel of Fig. 1, added by a constant (2 × 10-16erg s-1 cm-2 Å-1), for visual purposes. Red line: Sky spectra, which were derived as the median of the sky spectrum extracted from six different extraction regions located outside the overall structure of J1000+0234. Green line shows the residual between object and sky spectra and 1σ uncertainty of the sky spectrum is displayed with a blue line. Gray shaded area displays the 5σ level. [O ii] doublet wavelengths using redshifts from Lyα and 12CO(4−3) emission-lines are represented by dashed and dot-dashed vertical black lines, respectively (Capak et al. 2008; Schinnerer et al. 2008, see Table 1). Dotted vertical lines correspond to sky line wavelengths.
Current usage metrics show cumulative count of Article Views (full-text article views including HTML views, PDF and ePub downloads, according to the available data) and Abstracts Views on Vision4Press platform.
Data correspond to usage on the plateform after 2015. The current usage metrics is available 48-96 hours after online publication and is updated daily on week days.
Initial download of the metrics may take a while.