Fig. 4
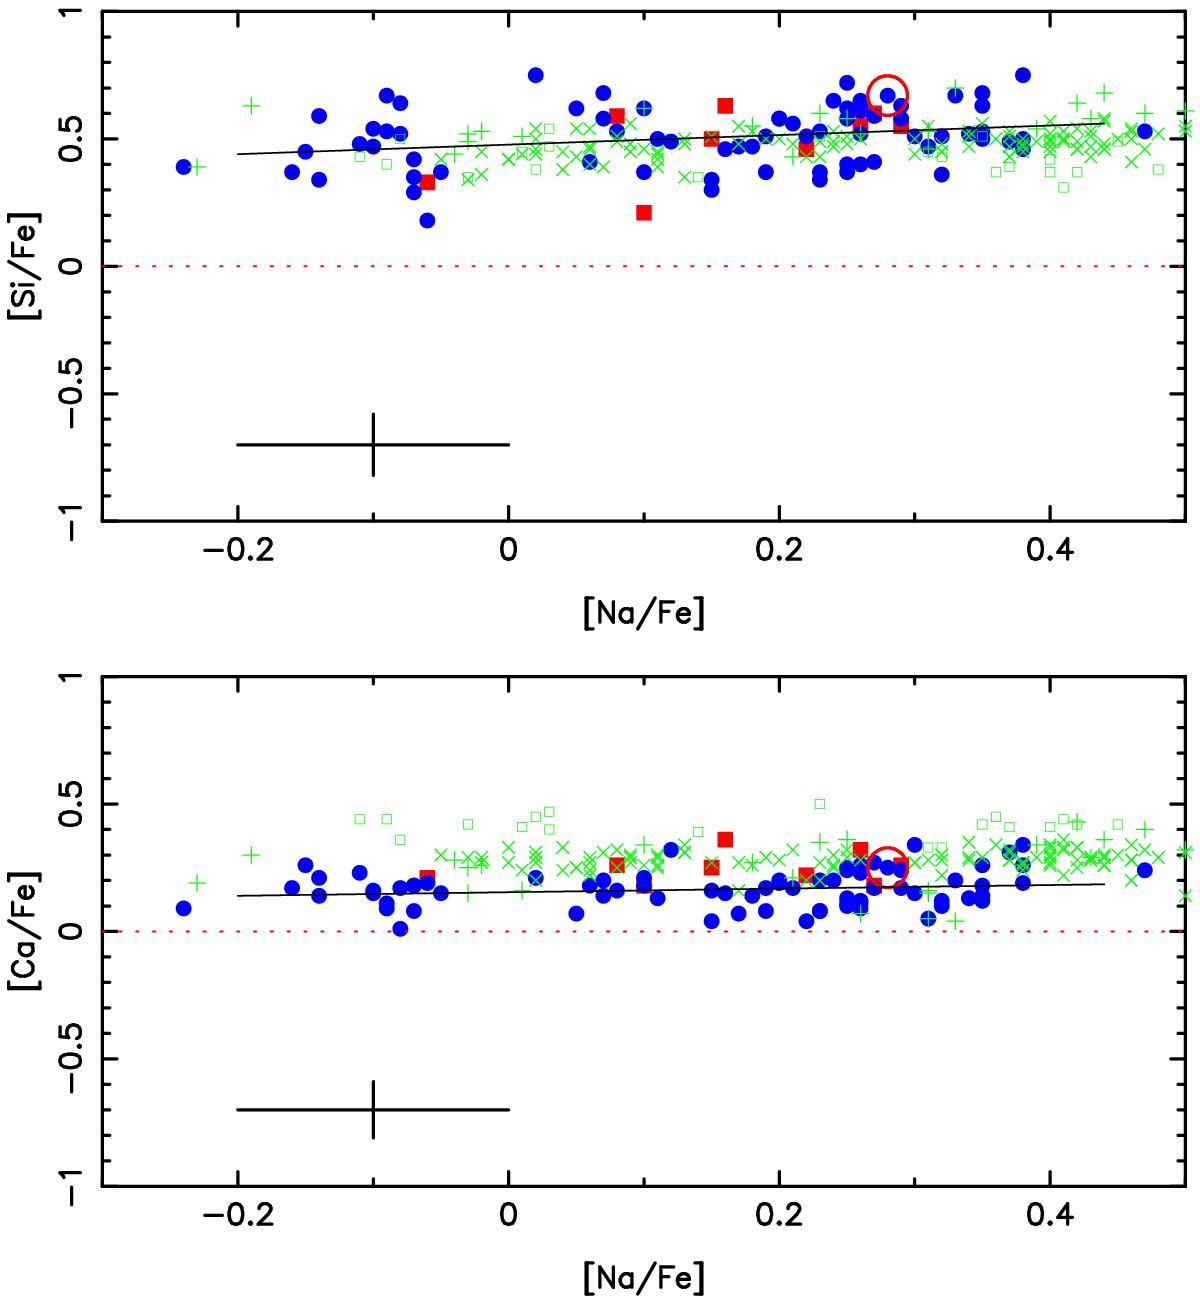
Relations between the abundances of the α elements Si (upper panel) and Ca (lower panel) vs. [Na/Fe]. The symbols are as in Fig. 3. In these two figures we compare the abundance measured in the turnoff stars to the abundances measured by Ivans et al. (1999), Marino et al. (2008) and Villanova & Geisler (2011) in samples of bright giants (respectively green +, × and □). The α-elements Si and Ca are overabundant relative to iron.
Current usage metrics show cumulative count of Article Views (full-text article views including HTML views, PDF and ePub downloads, according to the available data) and Abstracts Views on Vision4Press platform.
Data correspond to usage on the plateform after 2015. The current usage metrics is available 48-96 hours after online publication and is updated daily on week days.
Initial download of the metrics may take a while.