Fig. 3
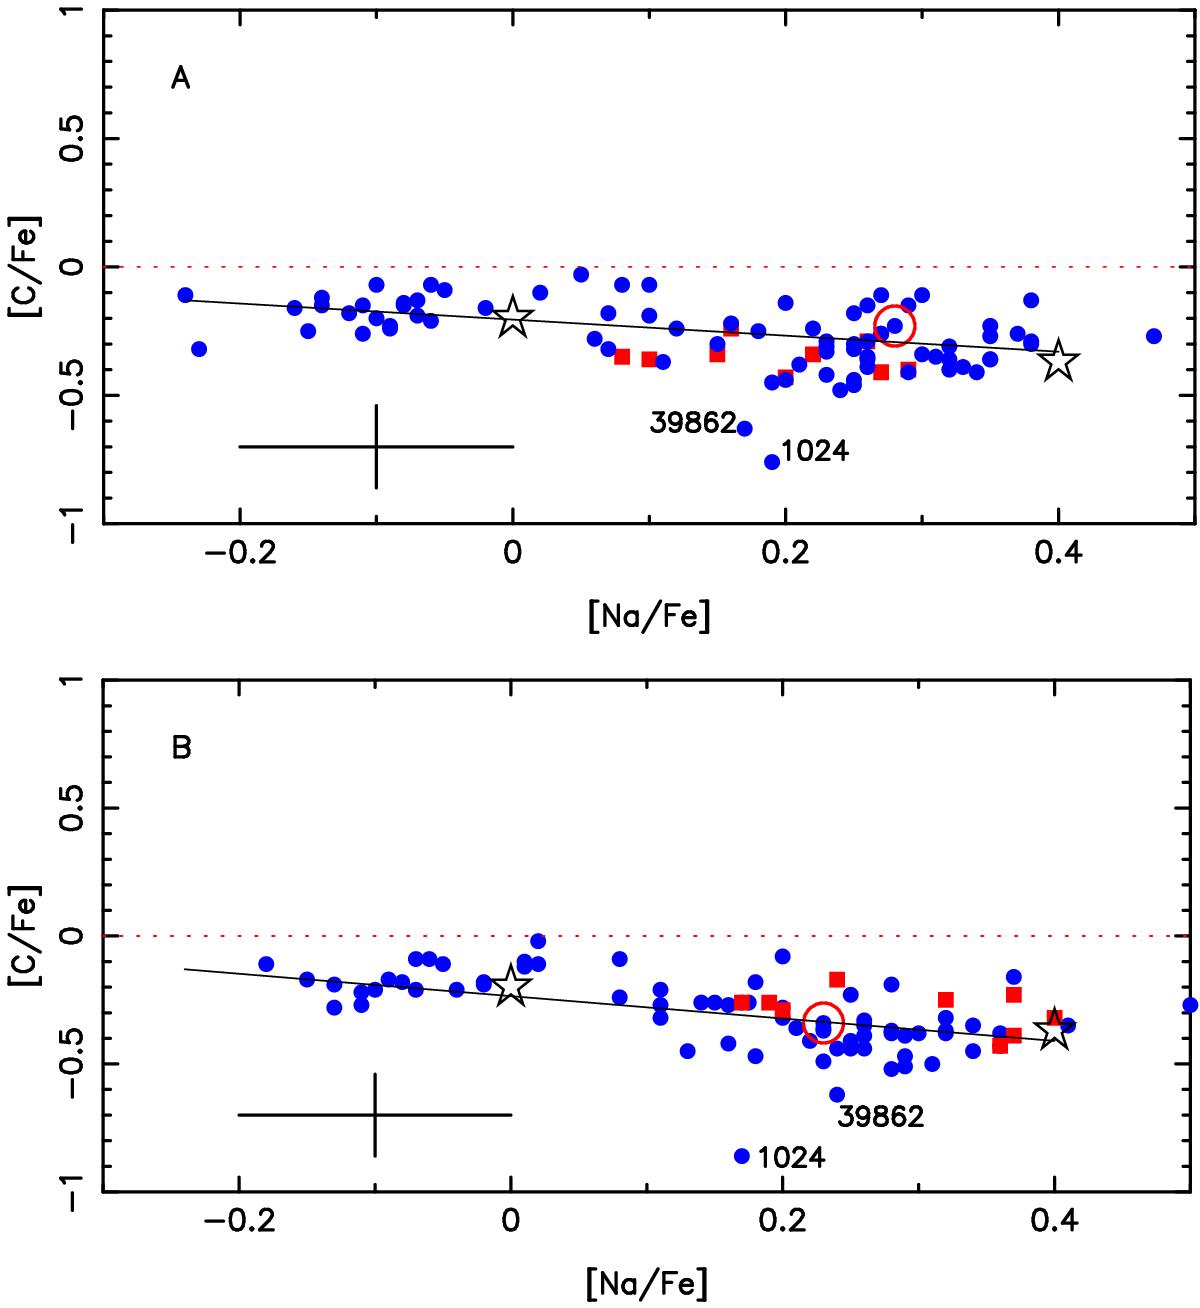
Relation between [C/Fe] and [Na/Fe] computed, A) with the model parameters Tefflog g and vt given in Monaco et al. (2012), and B) with the same parameters but vt =1.3 km s-1. The red squares represent the subgiant stars which have a temperature below 5600 K. The blue dots are for the turnoff stars with 5600 K < Teff < 5980 K. The very Li-rich star M4-37934 is surrounded by a red circle. A typical value of the total error is represented by the cross at the lower left corner of the figure. The mean values obtained for the two groups of RGB stars in M 4 by Villanova & Geisler (2011): C-rich N-poor stars and the C-poor N-rich stars are shown by black open stars symbols.
Current usage metrics show cumulative count of Article Views (full-text article views including HTML views, PDF and ePub downloads, according to the available data) and Abstracts Views on Vision4Press platform.
Data correspond to usage on the plateform after 2015. The current usage metrics is available 48-96 hours after online publication and is updated daily on week days.
Initial download of the metrics may take a while.