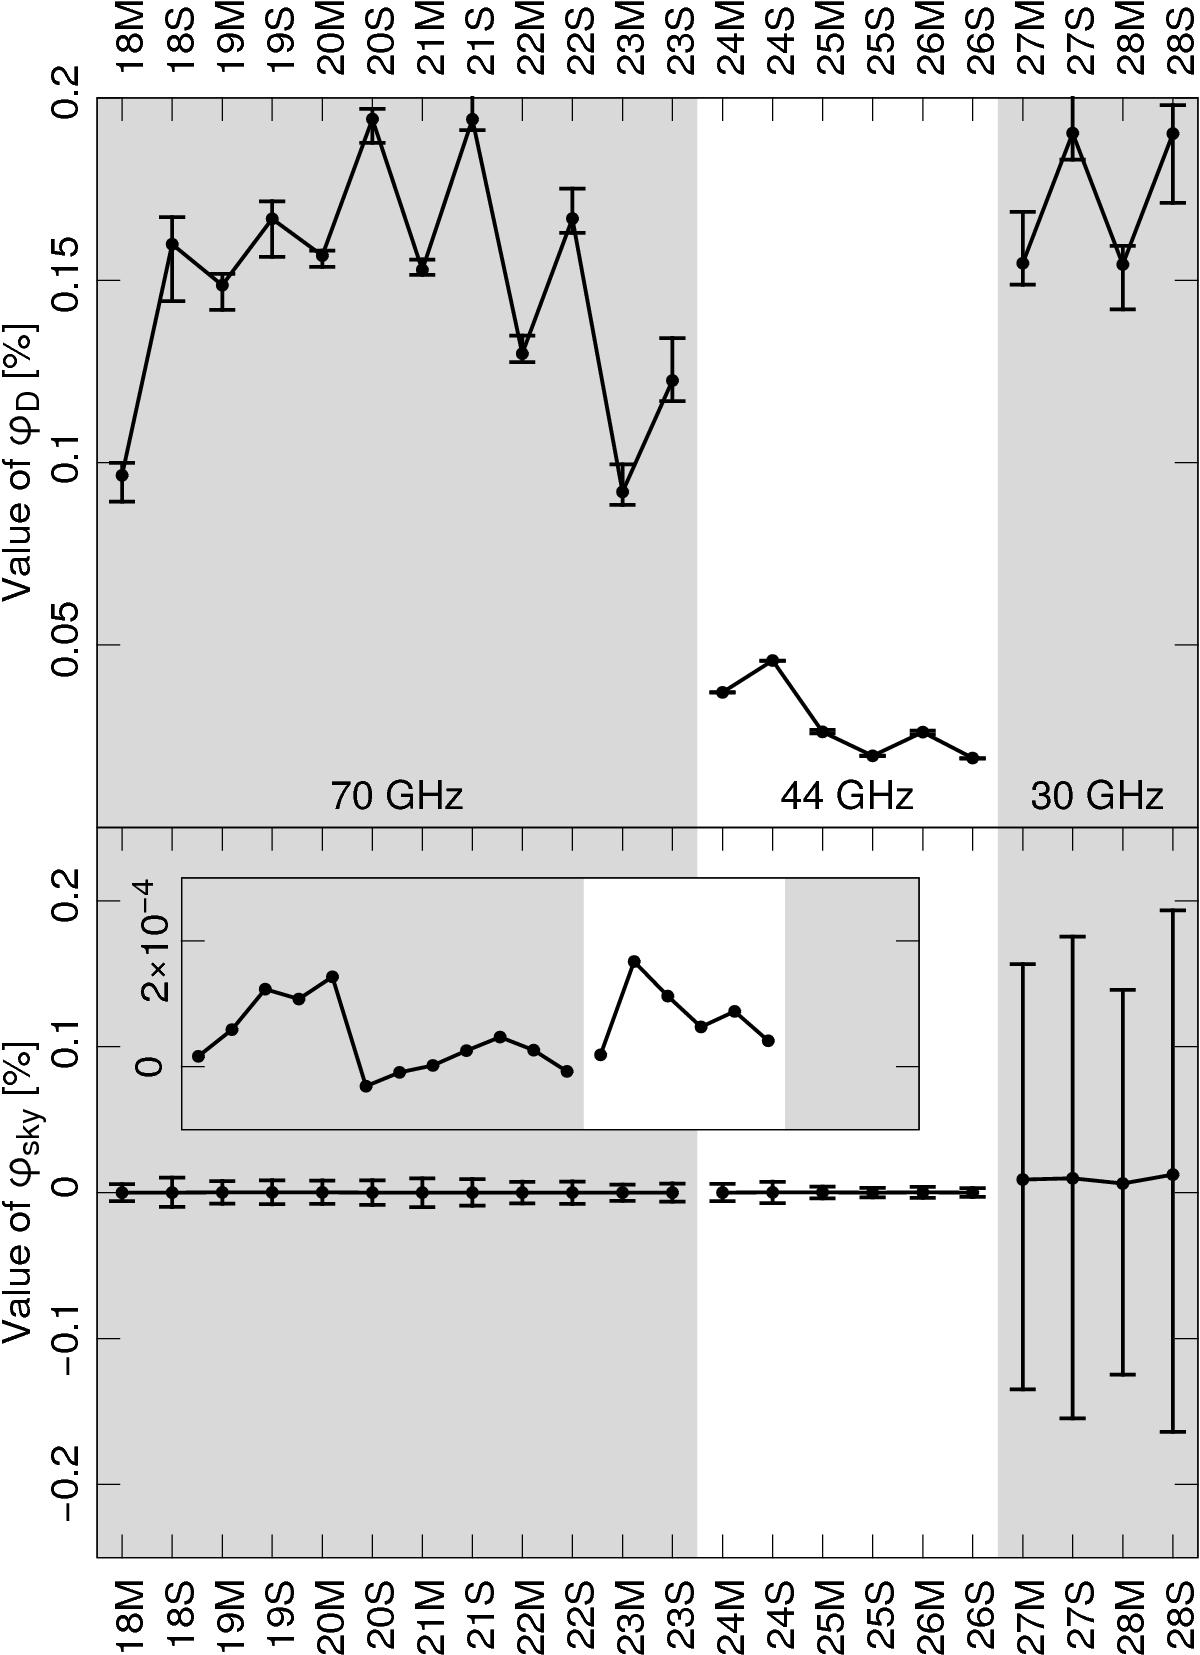
Fig. 7

Top: estimate of the value of φD (Eq. (6)) for each LFI radiometer during the whole mission. The plot shows the median value of φD over all the samples and the 25th and 75th percentiles (upper and lower bar). These bars provide an idea of the range of variability of the quantity during the mission; they are not an error estimate of the quantity itself. Bottom: estimate of the value of φsky (Eq. (8)). The points and bars have the same meaning as in the plot above. Because of the low value for the 44 and 70 GHz channels, the inset shows a zoom of their median values. The large bars for the 30 GHz channels are motivated by the coupling between the stronger foregrounds and the relatively large power falling in the sidelobes.
Current usage metrics show cumulative count of Article Views (full-text article views including HTML views, PDF and ePub downloads, according to the available data) and Abstracts Views on Vision4Press platform.
Data correspond to usage on the plateform after 2015. The current usage metrics is available 48-96 hours after online publication and is updated daily on week days.
Initial download of the metrics may take a while.


