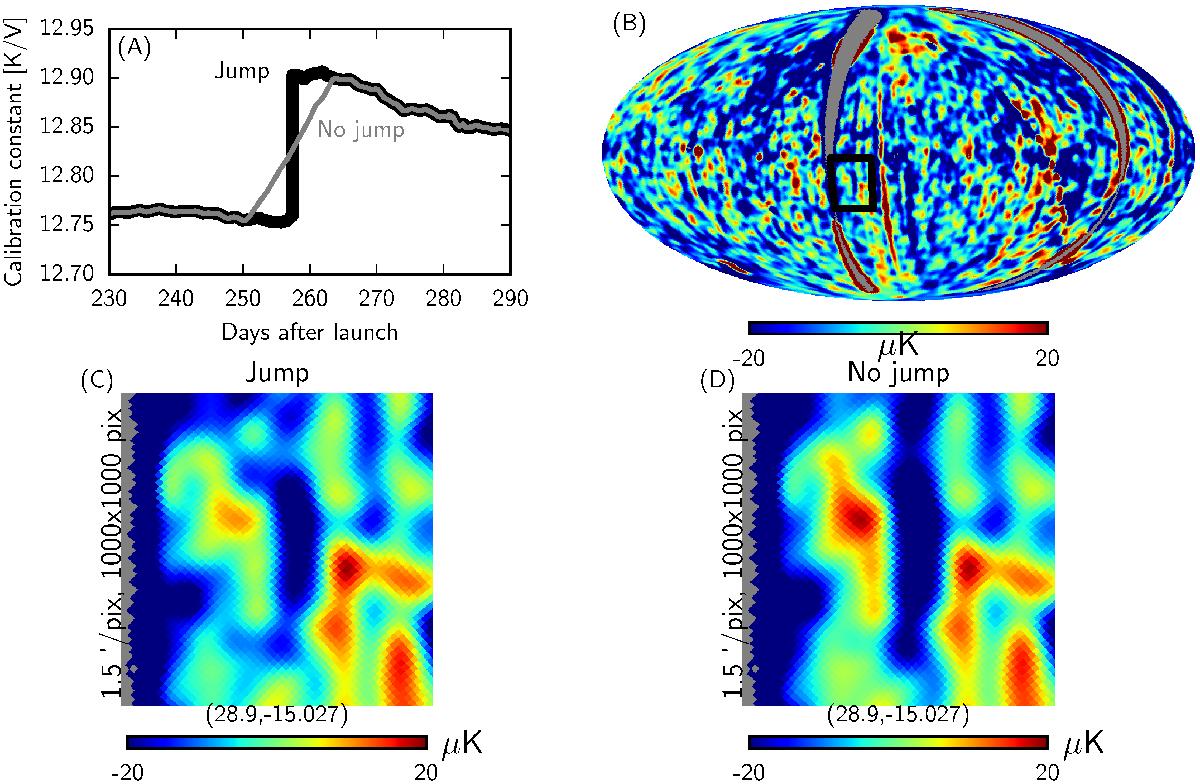
Fig. A.2

Comparison between the behaviour of the smoothing code in the nominal case and in the case where the jump near day 257 is considered to be a statistical fluctuation. Panel A): value of the calibration constant in the two cases. Fast variations have been removed from the data to make the plot clearer. If the jump is not considered to be real by the algorithm, the smoothing stage introduces an increasing slope in the values (thin grey line). Panel B): map of the difference between the maps from Surveys 1 and 2 (the jump happened during the first survey), in ecliptic coordinates. Residual systematic effects produce stripes that are either aligned with the direction of the scan (i.e., perpendicular to the ecliptic plane) or with the Galactic plane. The black square highlights a region in the map that has been observed during the jump near day 257. Panel C): zoom into the region highlighted in panel B) (the difference between maps from Surveys 1 and 2), when the jump near day 257 has been considered real (see Panel A), thick black line). Panel D): the same as the previous panel, but data have been calibrated assuming no real jump near day 257 (Panel A), thin grey line). Features are sharper in the latter case, and therefore we can conclude that the former calibration produces better results.
Current usage metrics show cumulative count of Article Views (full-text article views including HTML views, PDF and ePub downloads, according to the available data) and Abstracts Views on Vision4Press platform.
Data correspond to usage on the plateform after 2015. The current usage metrics is available 48-96 hours after online publication and is updated daily on week days.
Initial download of the metrics may take a while.


