Fig. 11

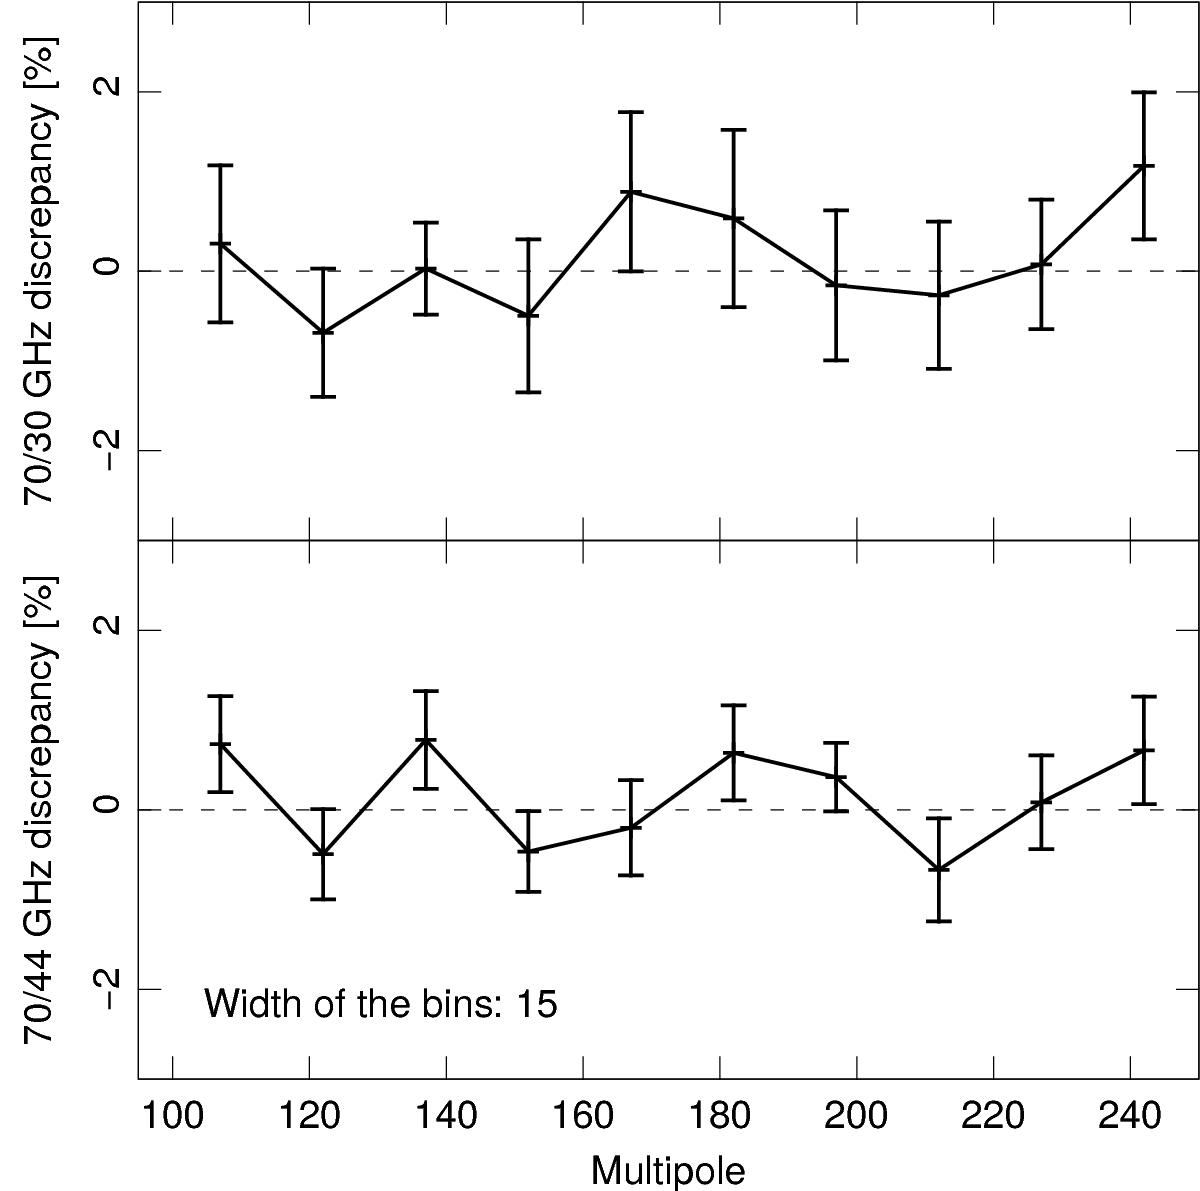
Estimate of ![]() (Eq. (45)), which quantifies the discrepancy between the level of the 70 GHz power spectrum and the level of another map. Top: comparison between the 70 GHz map and the 30 GHz map in the range of multipoles 100 ≤ ℓ ≤ 250. The error bars show the rms of the ratio within each bin of width 15. Bottom: the same comparison done between the 70 GHz map and the 44 GHz map. A 60% mask was applied before computing the spectra.
(Eq. (45)), which quantifies the discrepancy between the level of the 70 GHz power spectrum and the level of another map. Top: comparison between the 70 GHz map and the 30 GHz map in the range of multipoles 100 ≤ ℓ ≤ 250. The error bars show the rms of the ratio within each bin of width 15. Bottom: the same comparison done between the 70 GHz map and the 44 GHz map. A 60% mask was applied before computing the spectra.
Current usage metrics show cumulative count of Article Views (full-text article views including HTML views, PDF and ePub downloads, according to the available data) and Abstracts Views on Vision4Press platform.
Data correspond to usage on the plateform after 2015. The current usage metrics is available 48-96 hours after online publication and is updated daily on week days.
Initial download of the metrics may take a while.


