| Issue |
A&A
Volume 593, September 2016
|
|
|---|---|---|
| Article Number | A2 | |
| Number of page(s) | 17 | |
| Section | Cosmology (including clusters of galaxies) | |
| DOI | https://doi.org/10.1051/0004-6361/201628442 | |
| Published online | 29 August 2016 | |
Size growth of red-sequence early-type galaxies in clusters in the last 10 Gyr⋆
1 INAF–Osservatorio Astronomico di Brera, via Brera 28, 20121 Milano, Italy
e-mail: This email address is being protected from spambots. You need JavaScript enabled to view it.
2 Instituto de Astrofisica de Andalucia (CSIC), Glorieta de la Astronoma S/N, 18008 Granada, Spain
3 CEA, Centre de Saclay, IRFU/SPP, 91191 Gif-sur-Yvette, France
Received: 7 March 2016
Accepted: 28 May 2016
Abstract
We carried out a photometric and structural analysis in the rest-frame V band of a mass-selected (log M/M⊙> 10.7) sample of red-sequence galaxies in 14 galaxy clusters, 6 of which are at z> 1.45, namely JKCS041, IDCS J1426.5+3508, SpARCS104922.6+564032.5, SpARCSJ021524-034331, XDCPJ0044.0-2033, and SPT-CLJ2040-4451. To this end, we reduced/analyzed about 300 orbits of multicolor images taken with the Advanced Camera for Survey and the Wide Field Camera 3 on the Hubble Space Telescope. We uniformly morphologically classified galaxies from z = 0.023 to z = 1.803, and we homogeneously derived sizes (effective radii) for the entire sample. Furthermore, our size derivation allows, and therefore is not biased by, the presence of the usual variety of morphological structures seen in early-type galaxies, such as bulges, bars, disks, isophote twists, and ellipiticy gradients. By using such a mass-selected sample, composed of 244 red-sequence early-type galaxies, we find that the log of the galaxy size at a fixed stellar mass, log M/M⊙ = 11, has increased with time at a rate of 0.023 ± 0.002 dex per Gyr over the last 10 Gyr, in marked contrast with the threefold increase found in the literature for galaxies in the general field over the same period. This suggests, at face value, that secular processes should be excluded as the primary drivers of size evolution because we observed an environmental dependent size growth. Using spectroscopic ages of Coma early-type galaxies we also find that recently quenched early-type galaxies are a numerically minor population not different enough in size to alter the mean size at a given mass, which implies that the progenitor bias is minor, i.e., that the size evolution measured by selecting galaxies at the redshift of observation is indistinguishable from the one that compares ancestors and descendents.
Key words: galaxies: clusters: general / galaxies: elliptical and lenticular, cD / galaxies: evolution
Full Table 3 is only available at the CDS via anonymous ftp to cdsarc.u-strasbg.fr (130.79.128.5) or via http://cdsarc.u-strasbg.fr/viz-bin/qcat?J/A+A/593/A2
© ESO, 2016
1. Introduction
In ΛCDM-based models of galaxy formation, massive galaxies are expected to assemble hierarchically from mergers of smaller systems. Such models predict that the progenitors of today’s most massive galaxies formed stars in situ at z ≳ 2−3 in intense, short-lived bursts, while most of the subsequent mass assembly occurred via the accretion of stars formed in smaller systems (e.g., De Lucia & Blaizot 2007; Khochfar & Silk 2006). These predictions are supported by observations of the slowly evolving mass-to-light ratios of massive early-type galaxies (Treu et al. 2005) and by their high [α/ Fe] abundances (Thomas et al. 2005).
A striking result that demands explanation, however, is that quiescent massive galaxies at z = 2.5 seem typically 3−5 × smaller in physical size than local galaxies of equal stellar mass (see Newman et al. 2012, and references therein). Remarkably, about 40% of the expansion occurs within the redshift interval z = 1.5−2.5, corresponding to a period of only 1.6 Gyr. Apparently, this represents a key evolutionary period when the progenitors of today’s massive elliptical galaxies matured rapidly.
Sample, number of galaxies, and imaging exposure times for clusters at z> 1.
The most commonly posited mechanism for this growth is merging. Although major mergers involving near-equal mass galaxies are relatively rare and inefficient, minor mergers involving low-mass companions provide a promising explanation. Both simulations (e.g., Naab et al. 2009) and observations (Hopkins et al. 2009, Bezanson et al. 2009) suggest that stellar material accreted in minor mergers remains largely at large radii and contributes more to the growth in size than to the stellar mass (van Dokkum et al. 2010). Although the observed rate of minor mergers measured in deep CANDELS data appears sufficient to explain the size growth over 0 <z< 1.5 (Newman et al. 2012), it seems unable to account for the rapid growth during the formative period around z ≃ 2. Thus, additional processes may be required to complete our understanding of the assembly history of massive quiescent galaxies since z> 2.
Environmental trends offer a powerful way to make progress. In a merger-driven scenario we expect a strong dependence between the assembly rate and the local environment because galaxies inhabiting denser regions should experience more frequent mergers and demonstrate a faster growth rate (e.g., McIntosh et al. 2008). On the other hand, if secular processes are primarily responsible – for example, in models where adiabatic expansion results from mass expelled in stellar winds or by AGN (e.g., Fan et al. 2008; Damjanov et al. 2009; Ishibashi et al. 2013) – then the assembly rate should be mostly independent of environment. Much of the enhanced merging activities in dense systems should occur during the proto-cluster phase at high redshift when infalling groups have not yet virialized (e.g., Lotz et al. 2011). Evolved clusters have presumably progressed beyond the dominant merging phase leaving a clear imprint in the structure of the cluster galaxies.
Recognizing the advantage of contrasting size growth as a function of environment in the critical redshift interval 1.5 <z< 2.5, Hubble Space Telescope (HST) data on the z = 1.803 cluster JKCS 041 (Newman et al. 2014) revealed similar mass-age relations for an unprecedented large sample of 15 spectroscopically confirmed quiescent cluster galaxies when compared with a similarly selected field sample (Whitaker et al. 2013). While the quenching of star formation to produce quiescent systems is certainly more widespread in early clusters, it apparently proceeds at a pace independent of the environment (Newman et al. 2014). Regarding the question of environmentally dependent size growth to local galaxies, an intriguing difference was found: an upper limit of 0.22 dex growth was found from JKCS 041 to the Coma cluster in comparison with a measured variation of 0.47 dex for field galaxies over the same interval (Andreon et al. 2014). This supports accelerated growth in dense environments, such as would be the case for merging; however, a large sample is called for, in particular to confirm the effect currently based on just two clusters.
Quiescent galaxies at both high and low redshift have various structural components: high-redshift early-type galaxies are known to have a disk (e.g., van der Wel et al. 2011; Chang et al. 2013; Lang et al. 2014), i.e., not to be single-component galaxies, whereas local early-type galaxies are known to have bars, disks, ellipticity, and position angle gradients (e.g., Jedrzejewski et al. 1987; Bender & Moellenhoff 1987; Nieto & Bender 1989). Therefore, in order to derive reliable sizes, the model to be fitted to the galaxy surface brightness should not be an oversimplified description of nature complexity, for example one that adopts a radial-independent value for the galaxy ellipticity and position angle.
In this work, we uniformly analyze a sample of 14 galaxy clusters, 6 of which at z> 1.47. The remaining clusters uniformly sample the last 7 Gyr of the Universe age. All clusters are observed in the rest-frame V band and all galaxies are uniformly morphologically classified. Sizes are homogeneously derived for all galaxies and in a way that is unbiased by the presence of common components of early-type galaxies, such as bulges, disks, and bars. The resulting, mass-selected sample of 244 early-type (elliptical and lenticular) galaxies allows us to derive the galaxy size at a fixed stellar mass and how it depends on look-back time.
Throughout this paper, we assume ΩM = 0.3, ΩΛ = 0.7, and H0 = 70 km s-1 Mpc-1. Magnitudes are in the AB system. We use the 2003 version of Bruzual & Charlot (2003) stellar population synthesis models with solar metallicity and a Salpeter initial mass function (IMF). We use stellar masses that count only the mass in stars and their remnants. For a single stellar population, or τ = 0.1 Gyr model, the evolution of the stellar mass between 2 and 13 Gyr age is about 5% percent. Therefore, comparisons (e.g., of radii) at a fixed present-day mass is degenerate with comparisons with mass at the time of the observations (see Andreon et al. 2006 for a different situation).
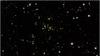 |
Fig. 1 Three-color (F105W-F140W-F160W) image of the z = 1.75 IDCS J1426.5+3508 cluster. Red-sequence, early-type galaxies are marked. The late-type morphology of most galaxies cannot be appreciated in this figure and requires inspecting the full-resolution fits image. |
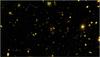 |
Fig. 2 Three-color (F814W-F105W-F160W) image of the z = 1.71 SpARCS104922.6+564032.5 cluster. Red-sequence, early-type galaxies are marked. The late-type morphology of most galaxies cannot be appreciated in this figure. |
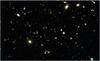 |
Fig. 3 Three-color (F105W-F140W-F160W) image of the z = 1.63 SpARCSJ021524-034331 cluster. Red-sequence, early-type galaxies are marked. The late-type morphology of most galaxies cannot be appreciated in this figure. |
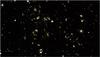 |
Fig. 4 Three-color (F105W-F140W-F160W) image of the z = 1.58 XDCP J0044.0-2033 cluster. Red-sequence, early-type galaxies are marked. The late-type morphology of most galaxies cannot be appreciated in this figure. |
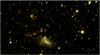 |
Fig. 5 Three-color (F814W-F105W-F140W) image of the z = 1.48 SPT-CL J2040-4451 cluster. Red-sequence, early-type galaxies are marked. The late-type morphology of most galaxies cannot be appreciated in this figure. |
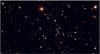 |
Fig. 6 Three-color (F814W-F105W-F140W) image of the z = 1.40 ISCS J1432.3+3253 cluster. Red-sequence, early-type galaxies are marked. The late-type morphology of most galaxies cannot be appreciated in this figure. |
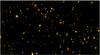 |
Fig. 7 Three-color (F814W-F105W-F140W) image of the z = 1.32 SPT-CL J0205-5829 cluster. Red-sequence, early-type, galaxies are marked. The late-type morphology of most galaxies cannot be appreciated in this figure. |
2. Data
2.1. z> 1 clusters
The data used in this paper for z> 1 clusters are from the Wide Field Camera 3 near-infrared (NIR) and ultraviolet-visible (UVIS, Kimble et al. 2008) and Advanced Camera for Survey (ACS, Sirianni et al. 2005) wide field camera imaging of the following clusters: JKCS041 at z = 1.80 (Andreon et al. 2009, Newman et al. 2014), IDCS J1426.5+3508 at z = 1.75 (Stanford et al. 2012), SpARCS104922.6+564032.5 at z = 1.71 (Webb et al. 2015), SpARCSJ021524-034331 at z = 1.63 (Muzzin et al. 2013), XDCP J0044.0-2033 at z = 1.58 (Santos et al. 2011), SPT-CL J2040-4451 at z = 1.48 (Bayliss et al. 2014), ISCS J1432.3+3253 at z = 1.40 (Zeimann et al. 2013), and SPT-CL J0205-5829 at z = 1.32 (Stalder et al. 2013). These are all z> 1.3 clusters with HST observations appropriate for this work (in depth and wavelength coverage). Details about exposure time and filters are in Table 1. Most of the data were observed for the various supernovae programs (PI Saul Perlmutter), many during the preparation of this work. We re-reduced all the data, about 166 HST orbits, starting from FLT (near–infrared datasets) or FLC (optical datasets) images to assure homogeneity between cluster and control field observations. Images are combined and resampled to 0.06 arcsec pixels using Astrodrizzle (DrizzlePac 2.0.2.dev42994 for images with λc> 1 μm, or v1.1.16 otherwise). Images in F105W are aligned with teakreg. These are used for alignment and as reference images so that the other filters exactly match the pixel scale, center, and tangent point of the output mosaics. ACS images, corrected for the effect of charge-transfer efficiency, were aligned using the procedure described in Dong et al. (2015) because there were too many cosmic rays. Briefly, for shift computation we use images with cosmic rays identified and flagged using L.A.COSMIC (van Dokkum 2001), while during coadding we leave astrodrizzle to find and flag cosmic rays.
Sample, number of galaxies, and imaging exposure times for clusters at z< 1.
Figures 1 to 7 show HST three-color images of the seven clusters without an earlier similar published image.
We use SExtractor (Bertin & Arnouts 1996) for detection and photometry. We use F140W for detection when it is availble (otherwise F160W), and we derive photometry in the other bands running SExtractor in dual-imaging mode. Colors are based on fluxes within the F140W isophote (when availble, otherwise F160W) with a minor correction for PSF differences across filters. The correction is derived comparing isophotal and 2.0 arcsec aperture colors of galaxies with isophotal sizes in the range of those studied in this paper (0.7 ≲ riso< 1.5 arcsec).
Only galaxies with log M/M⊙ ≳ 10.7 (derived as described in Sect. 3) and within ± 0.2 mag of the color–magnitude relation are considered, which corresponds to F140W ~ 22.7 mag, depending on redshift. Images are at least two mag deeper than this limit, and also allow us to characterize the faint end of the red sequence (Andreon et al., in prep.), not just the bright galaxies studied in this work. Indeed, morphological classification of galaxies in some of these clusters has already been performed in the past, sometimes using a reduced exposure time (Newman et al. 2014; Stanford et al. 2012; Tracy et al. 2015) or a worse resolution (Fassbender et al. 2014).
To estimate the number of back/foreground galaxies in the cluster line of sight we use three fields observed with the same filter set used for clusters. They are the Hubble Ultra Deep Field (HUDF) and two parallel observations of the Frontier Fields. We note that the Frontier Fields parallels are overdense of galaxies at z< 0.6 because they are parallel to intermediate redshift cluster observations. Contamination in the Frontier Fields parallels can be easily recognized and removed because these galaxies have a 4000 Å break in a much bluer filter than the F105W used for color measurements and therefore cannot be as red in F105W−F140W as those of interest here.
2.2. z< 1 clusters
To place our results in context and to have a more complete view of the redshift evolution, we consider a cluster sample at z< 1 with almost complete spectroscopic coverage so that the background contribution can be identified and individually removed from the sample. These clusters, listed in Table 2, are analyzed as z> 1 clusters. In particular, galaxies are selected within ± 0.2 mag of the red sequence using a color index bracketing the 4000 Å break.
RXJ0152.7-1357 (z = 0.84) uses ACS images taken from the Hubble Legacy Archive with 0.05 arcsec pixels. Spectroscopic redshifts are taken from Demarco et al. (2005; 2010).
MACSJ1149.5+2223 (z = 0.544) galaxies are initially photo-z member selected (i.e., | zphot−zspec | < 3σz where σz = 0.04 ∗ (1 + zspec)) using the Cluster Lensing and Supernova Survey with Hubble (CLASH, Postman et al. 2012) 16-band photometric redshifts. We then keep galaxies showing a passive type (BPZ most likely spectral type < 5.5). Finally, galaxies are selected according to color and morphology. Spectroscopic redshifts for almost all galaxies of interest are available in Treu et al. (2015) and Ebeling et al. (2014), making the photo-z pre-selection necessary only for excluding a few galaxies without a spectroscopic redshift but with a SED pointing toward a manifestly different redshift. Similarly, the passive pre-selection is in principle unnecessary because all non-passive galaxies are clearly non-early-type, which can be determined by eye. For the morphological analysis we use ACS images with 0.05 arcsec pixels, reduced in Andreon (2008). To test the effect of sampling and depth, we also analyze a few galaxies using the > 20 times longer exposures with 0.03 arcsec pixels recently acquired and available in the Hubble Legacy Archive.
MACSJ1206.2-0847 (z = 0.44) galaxies are photo-z selected, as MACSJ1149.5+2223 ones are, using CLASH (Postman et al. 2012) 16-band photometry, and then galaxies are selected according to color and morphology. Spectroscopic redshifts are available in Biviano et al. (2013), making the photo-z pre-selection almost un-necessary. For the morphological analysis we use ACS images with 0.065 arcsec pixels from Postman et al. (2012).
Abell 2744 (z = 0.306), also known as AC118, uses ACS images taken from the Hubble Legacy Archive with 0.03 arcsec pixels. The F814W image is impressive for its depth and sharpness. It allows a finer morphological analysis (e.g., detecting shells, lens, and external rings) of lower mass galaxies than needed here. Spectroscopic redshifts for virtually all galaxies of interest are available in Owers et al. (2011).
Abell 2218 (z = 0.1773) uses ACS images reduced for this work. Spectroscopic redshifts for all but one galaxy of interest are available in Le Borgne et al. (1992), Sanchez et al. (2007), and Haines et al. (2015).
Abell 1656 (Coma) galaxies use ground-based V- or r-band observations, typically 20 min long with < 1.2 arcsec seeing at a 2 m telescope (from Andreon et al. 1996; 1997). Effective radii, derived as in this work and using the same software, are available in the references mentioned.
Overall, we reduced about 200 HST orbits for this paper (for the morphological analysis of the high-redshift sample), and we analyzed images for more of 300 HST orbits.
3. Morphology, size, and stellar mass
In order to derive effective radii and total luminosities (to be used later for deriving the galaxy mass) we fit the galaxy isophotes, precisely as done for galaxies in different environments at low and intermediate redshift (e.g., Michard 1985; Poulain et al. 1992; Michard & Marshall 1993; 1994; Andreon 1994; Andreon et al. 1996; 1997, etc.).
Isophotes are decomposed in ellipses plus Fourier coefficients (Carter et al. 1978; Bender & Moellenhoff 1987; Michard & Simien 1988) to describe deviations from the perfect elliptical shape. Each isophote has a center, major and minor axes, position angle, and Fourier coefficients measuring deviations from a perfect ellipse. Parameters can differ from isophote to isophote allowing us to describe the brightness distribution of galaxies with structural components such as bars, disks, bulges, spiral arms, and HII regions. These structural components have distinctive signatures in the radial profiles of the isophote parameters, for example bars shows up as changes in position angle and/or axis ratio, disks are associated with changes of ellipticity (except when face on), spiral arms and other irregularities in the isophote shapes are measured by (some) non-zero Fourier coefficients, as shown in the papers mentioned above and also in Peng et al. (2010). We therefore classify galaxies by detecting morphological components in the radial profiles of the isophote parameters. Such a classification, based on measurement of distinctive features of morphological components, returns morphologies coincident with the ones performed by morphologists such as Hubble, Sandage, de Vaucouleurs, and Dressler (Michard & Marshall 1994; Andreon & Davoust 1997) who use visual inspection, rather than measurements, to detect structural components. Based on measurements, structural classification is more reproducible than morphologies based on visual inspection (Andreon & Davoust 1997).
This morphological classification allows us to remove from the sample non-early-type galaxies (i.e., spirals and irregulars), only keeping early-type (ellipical and lenticular) galaxies. Visual inspection of each of them in the different bands always confirmed the non-early-type nature of these galaxies, provided that images are displayed with the appropriate cuts, which is sometime cumbersome1.
To compute the total galaxy flux, and from it the galaxy mass and size, the flux between isophotes is analytically integrated up to the last detected isophote, hence determining the curve of growth. To extrapolate it to infinity, we fit the measured growth curve with a library of growth curves measured for galaxies of different morphological types in the nearby universe (de Vaucouleurs 1997), keeping the one that fits best. The half-light isophote is, by definition, the isophote including half the total light. The half-light circularized radius, re, is defined as the square root of area included in the half-light isophote divided by π. This definition allows us to define the half-light radius whatever the isophote shapes are and irrespective of wheter galaxies has a single value of ellipticity and position angle, or values that depend on radius, as barred galaxies, lenticulars, and many ellipticals have. The background light is accounted for, and subtracted, by fitting a low-order polynomial to the region surrounding the studied galaxy, and accounting for the galaxy flux at large radii. This also allows us to remove any residual gradient present in the image, that is due to, e.g., scattered or intracluster light.
Half-light radii derived from the curve of growth have been extensively used in the literature (e.g., Sandage 1972, de Vaucouleurs et al. 1976; Davies et al. 1983; Burstein et al. 1987; Dressler et al. 1987, Lucey et al. 1991; Bender et al. 1992; Saglia et al. 1993a; Jorgensen et al. 1995; Giavalisco et al. 1996; Andreon et al. 1996; 1997; Prugniel & Simien 1996; Pahre et al. 1995; 1998; Saglia et al. 2010) and the derivations by the different astronomers have been thoroughly and extensively compared (see the papers above and references therein). In particular, size derivation using the curve of growth, allowing the observed variety of morphological structures in galaxies, and HST data have been used since the HST repair (Andreon et al. 1997).
Masses of red-sequence early-type galaxies are derived from λ ≈ 6000 Å luminosities assuming our standard BC03 SSP model with zf = 3 (which in turn matches the red-sequence color). For red-sequence galaxies in JKCS041 this has been shown to introduce a negligible 0.10 dex scatter in mass and no bias compared to a derivation based on fitting 12 bands photometry and 3000−6000 Å spectroscopy (Andreon et al. 2014). A further check is given in Sect. 4. Figure 8 shows the uniform rest-frame sampling of the band used to derive morphologies, sizes, and masses.
4. Results
Table 3, available at the CDS, lists coordinates, mass, and size (half-light radius) of 158 red-sequence galaxies studied in this work. 86 more are listed in Andreon et al. (1996; 1997). Tables 1 and 2 summarize how many early-type galaxies more massive than log M/M⊙> 10.7 there are in each cluster. Except Coma, with 86 galaxies, each cluster has between 3 and 23 red-sequence early-type galaxies.
Figure 9 shows the color-magnitude relation of red-sequence early-type galaxies for clusters at z> 1. The region from which red-sequence early-type galaxies are selected (± 0.2 mag around the color-magnitude relation and log M/M⊙> 10.7) is shown in Fig. 9, both in the cluster and control field panels. There are only few galaxies in the control fields, and an even lower number is expected in the cluster line of sight because the solid angle of the latter is about three time smaller. From control field observations we computed the expected number of back/foreground galaxies in the cluster line of sight in the appropriate region of the color-magnitude plane (Table 1). We expect that out of 45 galaxies in the seven clusters at 1.3 <z< 1.79, only 5.5 are background galaxies. Therefore, the background contamination is minor (~ 10%) and a negligible source of error. We therefore neglect the background subtraction. JKCS041 has exactly zero background galaxies because all red-sequence early-type galaxies considered in this work are spectroscopic members (Newman et al. 2014).
Very few galaxies, less than one per cluster on average, are in such crowded environments that they cannot be reliably analyzed because their isophotes are, within a range of brightnesses, too much contaminated by the presence of other galaxies. These few galaxies, shown as open symbols in Fig. 9, are therefore ignored in this work.
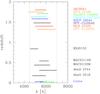 |
Fig. 8 Rest-frame wavelength sampling of the band used to derive morphologies, sizes, and masses. |
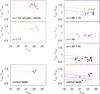 |
Fig. 9 Color–magnitude plot of red-sequence early-type galaxies. The slanted rectangles indicate the selection region (± 0.2 mag from the color-magnitude relation), with H magnitude brighter than a SSP with log M/M⊙ = 10.7, both in the cluster (upper panels) and reference (bottom panels) lines of sight. Clusters are color-coded as in Fig. 8. The open points indicate galaxies within the boundaries but with unfeasible isophotal analysis. |
Coordinates, masses, sizes, and PSF corrections.
Appendix A provides comments on individual galaxies or clusters. With very few, if any, exceptions, galaxies that are morphologically late and on the red sequence in the selection color are blue in bluer color indexes. Furthermore, at z< 1 about 83% of red-sequence galaxies have a known spectroscopic membership.
Morphologies, effective radii, and masses derived for seven (random) red-sequence early-type galaxies in MACSJ1149.5+2223, independently derived from images taken at different epochs (more than 10 yrs away), having widely different depths and sampling, and that have been stacked by different authors (Andreon 2008, and the Frontier Field initiative) are consistently the same, showing that improvements in the image alignment and stacking, a 20-fold increase in exposure time, and the additional resolution of a smaller pixel size are inconsequential for the bright objects studied in this work. Quantitatively, the morphologies are identical, the scatter in size is σ(log re) = 0.06 dex, and the scatter in mass is σ(log M/M⊙) = 0.04 dex.
Our simple recipe for mass computation has been tested with the galaxies in RXJ0152.7-1357, whose masses have been derived in Delaye et al. (2014) from SED fitting. The mass-size relation of this cluster (derived in Sect. 4.2), based on masses derived from our recipe, turns out to be identical to the one using masses derived from SED fitting, confirming the robustness of deriving masses for red-sequence early-type galaxies from a λ ~ 6000 Å total magnitude.
4.1. Smaller size at high redshift
The top panel of Fig. 10 shows the mass-size relation of red-sequence early-type galaxies color-coded by cluster ID for clusters at z> 1.45. As a comparison, the bottom panel shows Coma galaxies, which occupy the wedge between the two slanted lines, also shown in the top panel. As can be seen, at a given mass only the less extended galaxies are present in z> 1.45 clusters. The right panel of Fig. 11 quantifies this by plotting the size distribution, reduced to log M/M⊙ = 11 (i.e., corrected for the mass-size relation) for the Coma and our combined z> 1.45 cluster sample, i.e., the projection of Fig. 10 along a line of slope 0.6. This quantity is sometimes referred to as mass-normalized size (Newman et al. 2012; Cimatti et al. 2012; Delaye et al. 2014). Accounting for the slope between size and mass is important in order to reduce the effect of potentially different mass distributions across the samples, i.e., to discriminate real differences in size at a given mass from those spuriously induced by differences in mass across the samples. To match sample sizes, we normalize the Coma histogram by matching the number of galaxies with 10.7 < log M/M⊙< 10.9 (see also the left-hand panel). As can be seen from Fig. 10 and from the right–hand panels of Fig. 11, Coma galaxies are on average larger than our high-redshift sample: there are large (> 3 kpc) galaxies in Coma, which are absent in high-redshift clusters, and there is an excess of small (< 2 kpc) galaxies in the high-redshift sample, the smallest of which are absent in the low-redshift sample. A Kolmogorov-Smirnov test gives a vanishingly small (~ 4 × 10⁻⁴) “probability”2. The mass distributions of the two samples are shown in the left-hand panel of Fig. 11. They are quite similar (p-value: 0.13). Similar results are obtained replacing Coma with the two clusters at lower redshift observed with HST, indicating that the found size growth is not due to a Coma peculiarity.
We have so far neglected the effect of PSF blurring on half-radii to show that differences are not caused by the adoption of possibly incorrect point spread function (PSF) corrections. PSF blurring make high-redshift galaxies apparently larger, making even more significant the smaller size found at high redshift.
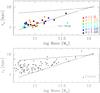 |
Fig. 10 Mass-size relation of red-sequence early-type cluster galaxies at z> 1.47 (points color-coded, upper panel) or Coma (z = 0.0232, bottom panel). Coma cluster galaxies occupy the wedge between the two slanted lines, reported in both panels. The horizontal dotted line in the top panel indicates the PSF FWHM. Sizes are not corrected for PSF blurring effects. |
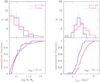 |
Fig. 11 Mass distribution (left) and size distribution (right) of log M/M⊙> 10.7 galaxies of high-redshift (blue) or Coma (red) cluster galaxies. Sizes are not corrected for PSF blurring effects. To account for the different richness of compared samples, we matched the number of galaxies with masses in the lowest mass bin. The outlier with smallest effective radius reduced to log M/M⊙ = 11 is the peculiar BCG of the z = 1.63 cluster. |
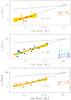 |
Fig. 12 Mass-size relation of red-sequence early-type cluster galaxies at z> 1. Sizes are corrected for PSF blurring effects. The solid line and shading shows the fitted mass-size relation and its 68% uncertainty (posterior highest density interval). The wedge between the two slanted lines is the locus of Coma galaxies. The horizontal dotted line indicates the PSF FWHM. |
 |
Fig. 13 Mass-size relation of red-sequence early-type cluster galaxies at z< 1. From top to bottom: RXJ0152.7-1357 (z = 0.84), MACSJ1149.5+2223 (z = 0.544), MACSJ1206.2-0847 (z = 0.44), Abell 2744 (z = 0.31), and Abell 2218 (z = 0.17). The relation for Coma is shown in the bottom panel of Fig. 10. Sizes are corrected for PSF blurring effects, but the correction is so small that it cannot be seen for these clusters. Points with black contours are spectroscopically confirmed galaxies. The red solid line and yellow shading show the fitted mass-size relation and its 68% uncertainty (posterior highest density interval). The wedge between the two slanted lines is the locus of Coma galaxies. The horizontal dotted line indicates the PSF FWHM (for Abell 2744 and Abell 2217 it is smaller than the displayed re range). |
4.2. PSF effects
The PSF smears images and therefore makes galaxies to appear larger than they actually are. We correct for PSF blurring by computing, following Saglia et al. (1993b), the size correction as a function of the observed half-light radius expressed in FWHM units and assuming an r1 / 4 radial profile. We applied the correction on a galaxy-by-galaxy basis, and we list the applied correction in Table 3. The correction is, in practice, zero at z< 0.8, negligible at z = 0.84, and then increases at higher redshifts mostly because of the broader PSF in NIR. The corrections remain small even at high redshift (for the two highest redshift clusters it has mean −0.08 dex and median −0.06 dex) basically because the average galaxy with log M/M⊙ = 11 has re>FWHM, where the correction is small. The NIR channel PSFs are approximated well by Gaussian profiles (Dressel 2012), and therefore these profiles are assumed in our calculations. From now on, all size measurements are corrected for PSF blurring.
4.3. How did the mass-size relation evolve?
In this section we determine how galaxy sizes (half-light radii) evolved by monitoring the mass-size relation at different redshifts. We fit the mass-size relation using a linear model with intrinsic scatter σ of the form  (1)adopting uniform priors for all parameters except the slope, for which we took instead a uniform prior on the angle. The parameter γ is, by definition, the average size at log M/M⊙ = 11. By allowing a non-zero scatter, the information content of each individual point has a minimal floor given by the large scatter, rather than by the smaller uncertainty of each size determination. Our approach, therefore, improves upon those works that only consider size errors as the unique source of uncertainty. By allowing the slope to be free, we de-weight galaxies with masses fairly different from log M/M⊙ = 11 in the determination of the average size at log M/M⊙ = 11 (i.e., γ), hence improving upon some previous analyses that hold the slope fixed, for example, Carollo et al. (2013) who assume α = 0 or Yano et al. (2016) who assume α = 0.75. By leaving the slope free we also allow different evolutions for galaxies of different mass, discarded a priori by those works that keep the slope fixed. We use, as mentioned, PSF corrected sizes. Because PSF corrections are small, our analysis is robust to PSF corrections and minimally changed if these are neglected.
Figures 12 and 13 show the mass-size relation for the various samples: the data, the fitted trend and its uncertainty. Fit parameters are listed in Table 4. Although not strictly necessary, we combine clusters at adjacent redshifts to reach a minimal number of ~ 20 galaxies per fit.
Figure 14 shows the effective radius at log M/M⊙ = 11 (i.e., γ) as a function of time. We fitted a linear relation adopting uniform priors for the intercept and the angle. We found  (2)The mean size of red-sequence early-type galaxies has grown by 5.4 ± 0.5% per Gyr at a fixed stellar mass over the last 10 Gyr. In other words, 10 Gyr ago sizes were 58% of the present-day sizes, or today the sizes are 1.7 times those of 10 Gyr ago. PSF corrections have little effect on the result: by neglecting them we would have found a slighly smaller evolution (about 3%) because of the overestimated sized at high redshift. The effective radius at z = 0 and log M/M⊙ = 11 is 2.1 kpc with 4% error, which is also independently confirmed using effective radii from other deep and high-resolution images of Coma galaxies in Jorgensen et al. (1995; 1999; plotted in Fig. 14), and other authors as well (e.g., Saglia et al. 1993a; Aguerri et al. 2004; Hoyos et al. 2011, details in Andreon et al. 2014). Figure 14 also shows the evolution determined by Newman et al. (2012) for field galaxies, which is much larger over the same redshift range. This curve should not be over-interpreted; it only gives the relative size evolution. The absolute normalization is arbitrary and depends on a number of things, such as the adopted initial stellar mass function, the way size is measured, and how the population under study is selected.
The scatter in size at a given mass does not show any clear trend with Universe age, staying constant at 0.1−0.2 dex. From inspection of Fig. 10 it is tempting to infer that the observed evolution in size at a given mass is produced by a new population occupying the upper part of the wedge at low redshift, i.e., that new low-redshift galaxies have large sizes at a given mass. However, we find no evidence of this effect with the current dataset after accounting for the evolution of the mean size at a given mass.
To summarize, we find that the log of the galaxy size at a fixed stellar mass increases with time with a minor rate in the last 10 Gyr, in marked contrast with the larger increase found in the literature for galaxies in the general field over the same period (see Sect. 5.1).
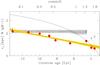 |
Fig. 14 Size at log M/M⊙ = 11 vs. redshift. The number above the points, when present, indicates the number of combined clusters. The solid line and shading show the fitted relation and its 68% uncertainty (posterior highest density interval). The curve indicates the evolution measured in the field by Newman et al. (2012); its absolute location is arbitrary and depends, among other things, on the adopted initial mass function and the way the population under study is selected. The almost horizontal line indicates the effect of progenitor bias on Coma galaxies. Its shading indicates the formal 68% uncertainty. The open square point is our fit of the mass-size relation using the data tabulated in Jorgensen et al. (1995; 1999) for early-type Coma galaxies. |
5. Discussion
Mass-size fitting parameters: intercept γ, slope α and intrinsic scatter σ for the various samples.
Before discussing our conclusions in the context of other works, we need to remember two differences. First, the half-light radius is the radius that enclosed half of the galaxy luminosity and our analysis strictly adopts this definition. Some other works adopt a different definition of galaxy size and, as discussed in Appendix B, these values should be combined with or compared to our half-light radii with great caution.
Second, we classify galaxies following the definitions of the morphological types. Some other works sometimes adopt different definitions for the morphological types, leading to samples 30% to 50% contaminated by non-early-type galaxies, as detailed in Appendix C. Galaxy populations selected with different criteria may well evolve differently.
Once considered these caveats, our results agree with literature analysis of galaxy cluster datasets, but constrain the size evolution more because of a more extended and more homogeneous sampling of the look-back time, a larger number of analyzed clusters, and more uniform morphological and half-light radii determinations.
5.1. Secular or environmental processes?
At first sight, the marked difference between the size evolution seen in clusters and the larger increase in size seen in field galaxies over the same 10 Gyr period (Fig. 14) excludes that secular processes, such as stellar winds and AGN, are primarily responsible of the galaxy radial growth because these processes operate independently of environment. However, this assumption strongly relies on the soundness of the derived mass-size relations. Although various works (e.g., Newman et al. 2012; van der Wel et al. 2014; Carollo et al. 2013) find consistent results for field samples, we note that first, these authors did not use half-light radii, but scale-lengths and these can be compared with caution with our radii because these authors hold ellipticity and position angle fixed at all radii for galaxies known to have gradients (see also Appendix B). On the other hand, by only comparing the size evolution, our comparison is unaffected by a redshift-independent systematics. Second, samples are usually not morphologically classified as we did for clusters (i.e., by resemblance to standard), but by other criteria. For example, van der Wel et al. (2014) do not morphologically classify galaxies at all, whereas Carollo et al. (2013) morphological classify galaxies using a support vector machine algorithm that in the case of the Delaye et al. (2012) sample returned a sample very contaminated by late-type galaxies (see Appendix C). Different galaxy populations (all quiescents vs. early-type quiescents) may well evolve differently. Third, morphological misclassification is ignored, with the exception of Newman et al. (2014), who find a consistent mass-size relation in the JKCS 041 cluster and in the coeval field after accounting for misclassification. Fourth, it is puzzling that galaxies have the same size in cluster and in the field at z = 0 (e.g., Pahre et al. 1998) and at z = 1.8 (Newman et al. 2014), but that the variation in size between these redshifts is different. Therefore, while the marked difference between evolution in cluster and field suggests excluding secular processes as being responsible for the galaxy radial growth, differences in the way galaxies are selected and sizes are measured preclude to draw a firm conclusion on which process shapes galaxy sizes.
5.2. Collective and individual size evolution?
At every redshift, we only consider galaxies that are quiescent and early-type at the cluster redshift, ignoring those that will be as such at z = 0. We have therefore determined the size growth of the population that is red and early-type at the redshift of observation. This determination is valuable because it is well-defined and reproducible, and it describes the evolution of a population selected at the redshift of observation.
If, however, galaxies become quiescent or morphologically early-type in high numbers in the last 10 Gyr, the size evolution derived above may differ from the evolution of the sample formed by the galaxies that will be quiescent and early-type at z = 0. In this case, our study is not comparing ancestors to descendents, an effect sometime called ancestor bias (Andreon & Ettori 1999; van Dokkum & Franx 2001). This is especially important for clusters, which have grown by a factor of three in mass (and plausible in galaxy content) since z ~ 2 (e.g., Fakhouri et al. 2010), which means that most of the z = 0 galaxies are not in the high-redshift sample (and especially so in the small field observed by HST), a point already discussed in the context of the mass-size relation in Andreon et al. (2014). In other words, we may be observing an almost static mass-size relation as a result of the balance of two galaxy populations, an older one evolving in one way and a newly quenched population evolving in a way to almost perfectly compensate the evolution of the older population.
Can we quantify the amount of newly quenched early-type galaxies, i.e., those not selected by our criteria at the redshift of observation but that will be at z = 0? Newly quenched early-type galaxies may come from four possible reservoirs. First, they can be blue at the cluster redshift. However, the fraction of blue galaxies is small and depends little on redshift except at masses lower than considered here (Raichoor & Andreon 2012), especially in the inner region of the cluster studied in our work because galaxies are mass-quenched at higher redshift (than studied by these authors, i.e., z< 1.2 with one exception). Therefore the blue galaxy population seems to make no (or little) contribution to the progenitor bias. Second, the newly quenched early-type galaxies may be inside our color selection but have a late-type morphology at the cluster redshift. This possibility indeed occurs at both extremes of the redshift range; there are well-known spiral galaxies on the Coma red sequence (e.g., Andreon 1996; Terlevich et al. 2001) and spectroscopically confirmed red-sequence but non-early-type galaxies in JKCS 041 (Newman et al. 2014 and this work). Third, galaxies can have a mass lower than the mass threshold at the redshift of observation, but will have a mass increase (e.g., because of star formation or minor mergers) that would make them to enter the sample at lower redshifts. This population is minor in size because the galaxy mass function in cluster does not evolve (e.g., De Propris et al. 1999; 2007; Andreon 2006; 2013), in particular those of quiescent galaxies (Andreon 2013; Andreon et al. 2014). Fourth, the newly quenched early-type galaxies may be outside the HST field of view, typically 0.5 Mpc at high redshift.
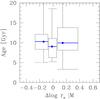 |
Fig. 15 Age distribution of Coma early-type galaxies smaller/ average/larger for their mass. The plot is a standard box-whisker: the vertical box width delimits the 1st and 3rd quartile, while the median (2nd quartile) is indicated by the horizontal (blue) segment inside the box. The horizontal box width is the full x range of each bin, while the error bars reach the minimum/maximum in the ordinate. Observed ages can be older than the Universe age because of errors. |
The impact of the newly quenched population, irrespective of their location in the color-magnitude plane or in space at the redshift of observation, can be estimated from fossil evidence, i.e., by taking an age-tagged mass-size relation in the local Universe and checking for a trend between age and vertical offset from the mean mass-size relation. This is illustrated for Coma early-type galaxies (morphologies from Andreon et al. 1996; 1997; spectroscopic ages from Smith et al. 2012) with the whisker plot in Fig. 15 showing the age distribution of galaxies smaller/average/larger for their mass (from left to right in the figure). The median age is as large as the times considered in this work (10 Gyr) with little or no dependence on the offset from the mean mass-size relation. More than 50% of larger galaxies for their mass are > 10 Gyr old, i.e., would be in our z ~ 1.5 sample, and > 75% of them are old enough to be in our z< 1 samples. The population of newly quenched galaxies (i.e., young) is therefore too small numerically and not different enough in size at a given mass to be able to alter the location of the mean mass-size relation. Quantitatively, we fit the Coma mass-size excluding from it galaxies with ages that would make them not selected at the various cluster redshifts because bluer than our threshold for inclusion (0.2 mag bluer than the red sequence). Figure 14 shows the result of this exercise: the mean galaxy size at log M/M⊙ = 11 changes by 0.01 ± 0.03 between today and t = 4.5 Gyr, in agreement with a similar computation on a reduced redshift range by Jorgensen et al. (2014)3. The shading gives the negligible 68% uncertainty ignoring errors on the age determinations of the individual galaxies. Ages become less reliable with look-back time,and this is reason why we did not extrapolate past t = 4.5 Gyr. To summarize, judging from what we see at z = 0, the newly quenched population is numerically minor and not different enough in size at a given mass to be able to significatively alter the location of the mean mass-size relation. Therefore, the size evolution measured by selecting galaxies at the redshift of observation is indistinguishable from the evolution that compares ancestors and descendents.
6. Conclusions
We carried out a photometric and structural analysis in the rest-frame V-band of a mass-selected (log M/M⊙> 10.7) sample of red-sequence galaxies in 14 galaxy clusters, 6 of which are at the key redshift where most of the size evolution occurs in the field, z> 1.45. These are JKCS041, IDCS J1426.5+3508, SpARCS104922.6+564032.5, SpARCSJ021524-034331, XDCPJ0044.0-2033, and SPT-CLJ2040-4451. The other eight clusters uniformly sample the last 7 Gyr of the Universe age. To measure the size evolution of red-sequence early-type galaxies, we reduced and analyzed about 300 orbits of multicolor images taken by the Hubble Space Telescope. We uniformly morphologically classified galaxies from z = 0.023 to z = 1.803, and we homogeneously derived sizes (half-light radii) for the entire sample. Our size derivation allows the presence of the variety of morphological structures usually seen in early-type galaxies, such as bulges, bars, disks, isophote twists, and ellipiticy gradients. For this reason, it is unbiased by these structural components. By using such a mass-selected sample, composed of 244 red-sequence early-type galaxies, we find that the log of the galaxy size at a fixed stellar mass has increased with time with a rate of 0.023 ± 0.002 dex per Gyr over the last 10 Gyr, in marked contrast with the threefold increase found in the literature for galaxies in the general field over the same period. If we trust the field determination, the marked difference between the size evolution seen in clusters and in field galaxies over the same 10 Gyr period excludes that secular processes, such as stellar winds and AGN, are primarily responsible for the galaxy radial growth because such processes operate independently of environment. However, differences in the way sizes are derived and samples are selected in the different environments preclude any firm conclusion. Using spectroscopic ages of Coma early-type galaxies we also find that recently quenched early-type galaxies are a numerically minor population not different enough in size to alter the mean size at a given mass, which implies that the progenitor bias is minor, i.e., that the size evolution measured by selecting galaxies at the redshift of observation is indistinguishable from the one that compares ancestors and descendents.
To put firmer constraints on the physical processes responsible for this size evolution, this work could be extended in three interesting directions. First, by duplicating a similar homogeneous analysis on a field sample to allow a fair comparison with our cluster sample. Second, by considering separately E and S0 galaxies, given the debate on their possible differential evolution (e.g., Dressler et al. 1997 vs. Andreon 1998; Lubin et al. 1998; Holden et al. 2009; Burstein et al. 2005). Third, by duplicating the progenitor bias computation but reducing the extrapolation, i.e., using a sample at z ≫ 0.
In turn, our structural analysis can be used to qualify the quality of the stacked images: the morphological components leaves such standard signatures in the isophote parameter radial profile that we are able to discover from the unusual shape of ther radial profiles of Fourier terms that the stacked MACSJ1206-08 F606W image delivered by CLASH (Postman et al. 2012) has been not properly combined. The HST archive confirmed us that the combined images have different distortion patterns as a result of the large time baseline over which they were taken, but only one single distortion pattern has been used to produce the stack.
To be precise, this is a p-value, not a probability.
Acknowledgments
S.A. thanks Richard Ellis, Drew Newman, and Tommaso Treu for the paper’s introduction, largely drawn from a proposal written together. We thank Tommaso Treu/Chris Haines for the spectroscopic catalog of MACSJ1144/A2218, made available in advance of publication. We thank Russell Smith for letting us use the full Coma spectroscopic catalog in advance of publication. We thank Saul Perlmutter for observing and making immediately public the high-redshift clusters analyzed here. We also thank Sirio Belli, Chris Haines, Drew Newman, Roberto Saglia, Paolo Saracco, and Veronica Strazzullo for comments on an earlier version of this draft. Finally, we thank the HST archive (full acknowledgment is available at https://archive.stsci.edu/hst/acknowledgments.html).
References
- Aguerri, J. A. L., Iglesias-Paramo, J., Vilchez, J. M., & Muñoz-Tuñón, C. 2004, AJ, 127, 1344 [NASA ADS] [CrossRef] [Google Scholar]
- Andreon, S. 1994, A&A, 284, 801 [NASA ADS] [Google Scholar]
- Andreon, S. 1996, A&A, 314, 763 [NASA ADS] [Google Scholar]
- Andreon, S. 1998, ApJ, 501, 533 [NASA ADS] [CrossRef] [Google Scholar]
- Andreon, S. 2006, A&A, 448, 447 [NASA ADS] [CrossRef] [EDP Sciences] [Google Scholar]
- Andreon, S. 2008, MNRAS, 386, 1045 [NASA ADS] [CrossRef] [Google Scholar]
- Andreon, S. 2013, A&A, 554, A79 [NASA ADS] [CrossRef] [EDP Sciences] [Google Scholar]
- Andreon, S., & Davoust, E. 1997, A&A, 319, 747 [NASA ADS] [Google Scholar]
- Andreon, S., & Ettori, S. 1999, ApJ, 516, 647 [NASA ADS] [CrossRef] [Google Scholar]
- Andreon, S., Davoust, E., Michard, R., Nieto, J.-L., & Poulain, P. 1996, A&AS, 116, 429 [NASA ADS] [CrossRef] [EDP Sciences] [Google Scholar]
- Andreon, S., Davoust, E., & Heim, T. 1997a, A&A, 323, 337 [NASA ADS] [Google Scholar]
- Andreon, S., Davoust, E., & Poulain, P. 1997b, A&AS, 126, 67 [NASA ADS] [CrossRef] [EDP Sciences] [Google Scholar]
- Andreon, S., Maughan, B., Trinchieri, G., & Kurk, J. 2009, A&A, 507, 147 [NASA ADS] [CrossRef] [EDP Sciences] [Google Scholar]
- Andreon, S., Newman, A. B., Trinchieri, G., et al. 2014, A&A, 565, A120 [NASA ADS] [CrossRef] [EDP Sciences] [Google Scholar]
- Bayliss, M. B., Ashby, M. L. N., Ruel, J., et al. 2014, ApJ, 794, 12 [NASA ADS] [CrossRef] [Google Scholar]
- Belli, S., Newman, A. B., & Ellis, R. S. 2015, ApJ, 799, 206 [NASA ADS] [CrossRef] [Google Scholar]
- Bender, R., & Moellenhoff, C. 1987, A&A, 177, 71 [NASA ADS] [Google Scholar]
- Bender, R., Burstein, D., & Faber, S. M. 1992, ApJ, 399, 462 [NASA ADS] [CrossRef] [Google Scholar]
- Bertin, E., & Arnouts, S. 1996, A&AS, 117, 393 [NASA ADS] [CrossRef] [EDP Sciences] [Google Scholar]
- Bezanson, R., van Dokkum, P. G., Tal, T., et al. 2009, ApJ, 697, 1290 [NASA ADS] [CrossRef] [Google Scholar]
- Biviano, A., Rosati, P., Balestra, I., et al. 2013, A&A, 558, A1 [NASA ADS] [CrossRef] [EDP Sciences] [Google Scholar]
- Blakeslee, J. P., Holden, B. P., Franx, M., et al. 2006, ApJ, 644, 30 [NASA ADS] [CrossRef] [Google Scholar]
- Bruzual, G., & Charlot, S. 2003, MNRAS, 344, 1000 [NASA ADS] [CrossRef] [Google Scholar]
- Burstein, D., Davies, R. L., Dressler, A., et al. 1987, ApJS, 64, 601 [NASA ADS] [CrossRef] [Google Scholar]
- Burstein, D., Ho, L. C., Huchra, J. P., & Macri, L. M. 2005, ApJ, 621, 246 [NASA ADS] [CrossRef] [Google Scholar]
- Carollo, C. M., Bschorr, T. J., Renzini, A., et al. 2013, ApJ, 773, 112 [NASA ADS] [CrossRef] [Google Scholar]
- Carter, D. 1978, MNRAS, 182, 797 [NASA ADS] [CrossRef] [Google Scholar]
- Chang, Y.-Y., van der Wel, A., Rix, H.-W., et al. 2013, ApJ, 762, 83 [NASA ADS] [CrossRef] [Google Scholar]
- Chiboucas, K., Barr, J., Flint, K., et al. 2009, ApJS, 184, 271 [NASA ADS] [CrossRef] [Google Scholar]
- Cimatti, A., Nipoti, C., & Cassata, P. 2012, MNRAS, 422, L62 [NASA ADS] [CrossRef] [Google Scholar]
- Damjanov, I., McCarthy, P. J., Abraham, R. G., et al. 2009, ApJ, 695, 101 [NASA ADS] [CrossRef] [Google Scholar]
- Davies, R. L., Efstathiou, G., Fall, S. M., Illingworth, G., & Schechter, P. L. 1983, ApJ, 266, 41 [NASA ADS] [CrossRef] [Google Scholar]
- Delaye, L., Huertas-Company, M., Mei, S., et al. 2014, MNRAS, 441, 203 [NASA ADS] [CrossRef] [Google Scholar]
- De Lucia, G., & Blaizot, J. 2007, MNRAS, 375, 2 [NASA ADS] [CrossRef] [Google Scholar]
- Demarco, R., Rosati, P., Lidman, C., et al. 2005, A&A, 432, 381 [NASA ADS] [CrossRef] [EDP Sciences] [Google Scholar]
- Demarco, R., Gobat, R., Rosati, P., et al. 2010, ApJ, 725, 1252 [NASA ADS] [CrossRef] [Google Scholar]
- De Propris, R., Stanford, S. A., Eisenhardt, P. R., Dickinson, M., & Elston, R. 1999, AJ, 118, 719 [NASA ADS] [CrossRef] [Google Scholar]
- De Propris, R., Stanford, S. A., Eisenhardt, P. R., Holden, B. P., & Rosati, P. 2007, AJ, 133, 2209 [NASA ADS] [CrossRef] [Google Scholar]
- De Propris, R., Bremer, M. N., & Phillipps, S. 2015, MNRAS, 450, 1268 [NASA ADS] [CrossRef] [Google Scholar]
- De Propris, R., Bremer, M., & Phillipps, S., et al. 2016, MNRAS, submitted [arXiv:1606.07192] [Google Scholar]
- Djorgovski, S., & Davis, M. 1987, ApJ, 313, 59 [NASA ADS] [CrossRef] [Google Scholar]
- de Vaucouleurs, G. 1977, ApJS, 33, 211 [NASA ADS] [CrossRef] [Google Scholar]
- de Vaucouleurs, G., de Vaucouleurs, A., & Corwin, J. R. 1976, Second reference catalogue of bright galaxies (Austin: University of Texas Press) [Google Scholar]
- Dong, H., Li, Z., Wang, Q. D., et al. 2015, MNRAS, 451, 4126 [NASA ADS] [CrossRef] [Google Scholar]
- Dressel, L. 2012, Wide Field Camera 3, HST Instrument Handbook (Baltimore: STScI) [Google Scholar]
- Dressler, A., Lynden-Bell, D., Burstein, D., et al. 1987, ApJ, 313, 42 [NASA ADS] [CrossRef] [Google Scholar]
- Ebeling, H., Ma, C.-J., & Barrett, E. 2014, ApJS, 211, 21 [NASA ADS] [CrossRef] [EDP Sciences] [Google Scholar]
- Fakhouri, O., Ma, C.-P., & Boylan-Kolchin, M. 2010, MNRAS, 406, 2267 [NASA ADS] [CrossRef] [Google Scholar]
- Fan, L., Lapi, A., De Zotti, G., & Danese, L. 2008, ApJ, 689, L101 [NASA ADS] [CrossRef] [Google Scholar]
- Fassbender, R., Nastasi, A., Santos, J. S., et al. 2014, A&A, 568, A5 [NASA ADS] [CrossRef] [EDP Sciences] [Google Scholar]
- Giavalisco, M., Steidel, C. C., & Macchetto, F. D. 1996, ApJ, 470, 189 [NASA ADS] [CrossRef] [Google Scholar]
- Haines, C. P., Pereira, M. J., Smith, G. P., et al. 2015, ApJ, 806, 101 [NASA ADS] [CrossRef] [Google Scholar]
- Holden, B. P., Franx, M., Illingworth, G. D., et al. 2009, ApJ, 693, 617 [NASA ADS] [CrossRef] [Google Scholar]
- Hopkins, P. F., Bundy, K., Murray, N., et al. 2009, MNRAS, 398, 898 [NASA ADS] [CrossRef] [Google Scholar]
- Hoyos, C., den Brok, M., Verdoes Kleijn, G., et al. 2011, MNRAS, 411, 2439 [NASA ADS] [CrossRef] [Google Scholar]
- Kimble, R. A., MacKenty, J. W., O’Connell, R. W., & Townsend, J. A. 2008, Proc. SPIE, 7010, 70101 [Google Scholar]
- Khochfar, S., & Silk, J. 2006, MNRAS, 370, 902 [NASA ADS] [CrossRef] [Google Scholar]
- Ishibashi, W., Fabian, A. C., & Canning, R. E. A. 2013, MNRAS, 431, 2350 [NASA ADS] [CrossRef] [Google Scholar]
- Jedrzejewski, R. I. 1987, MNRAS, 226, 747 [Google Scholar]
- Jorgensen, I., Franx, M., & Kjaergaard, P. 1995, MNRAS, 273, 1097 [NASA ADS] [CrossRef] [Google Scholar]
- Jørgensen, I., Franx, M., Hjorth, J., & van Dokkum, P. G. 1999, MNRAS, 308, 833 [NASA ADS] [CrossRef] [Google Scholar]
- Jørgensen, I., Chiboucas, K., Toft, S., et al. 2014, AJ, 148, 117 [NASA ADS] [CrossRef] [Google Scholar]
- La Barbera, F., Busarello, G., Merluzzi, P., Massarotti, M., & Capaccioli, M. 2003, ApJ, 595, 127 [NASA ADS] [CrossRef] [Google Scholar]
- Le Borgne, J. F., Pello, R., & Sanahuja, B. 1992, A&AS, 95, 87 [NASA ADS] [Google Scholar]
- Lotz, J. M., Jonsson, P., Cox, T. J., et al. 2011, ApJ, 742, 103 [NASA ADS] [CrossRef] [Google Scholar]
- Lubin, L. M., Postman, M., Oke, J. B., et al. 1998, AJ, 116, 584 [NASA ADS] [CrossRef] [Google Scholar]
- Lucey, J. R., Guzman, R., Carter, D., & Terlevich, R. J. 1991, MNRAS, 253, 584 [NASA ADS] [CrossRef] [Google Scholar]
- McIntosh, D. H., Guo, Y., Hertzberg, J., et al. 2008, MNRAS, 388, 1537 [NASA ADS] [CrossRef] [Google Scholar]
- Michard, R. 1985, A&AS, 59, 205 [NASA ADS] [Google Scholar]
- Michard, R., & Marchal, J. 1993, A&AS, 98, 29 [NASA ADS] [Google Scholar]
- Michard, R., & Marchal, J. 1994, A&AS, 105, 481 [NASA ADS] [Google Scholar]
- Michard, R., & Simien, F. 1988, A&AS, 74, 25 [NASA ADS] [Google Scholar]
- Muzzin, A., Wilson, G., Demarco, R., et al. 2013, ApJ, 767, 39 [NASA ADS] [CrossRef] [Google Scholar]
- Naab, T., Johansson, P. H., & Ostriker, J. P. 2009, ApJ, 699, L178 [NASA ADS] [CrossRef] [Google Scholar]
- Newman, A. B., Ellis, R. S., Bundy, K., & Treu, T. 2012, ApJ, 746, 162 [NASA ADS] [CrossRef] [Google Scholar]
- Newman, A. B., Ellis, R. S., Andreon, S., et al. 2014, ApJ, 788, 51 [NASA ADS] [CrossRef] [Google Scholar]
- Nieto, J.-L., & Bender, R. 1989, A&A, 215, 266 [NASA ADS] [Google Scholar]
- Owers, M. S., Randall, S. W., Nulsen, P. E. J., et al. 2011, ApJ, 728, 27 [NASA ADS] [CrossRef] [Google Scholar]
- Pahre, M. A., Djorgovski, S. G., & de Carvalho, R. R. 1995, ApJ, 453, L17 [NASA ADS] [CrossRef] [Google Scholar]
- Pahre, M. A., de Carvalho, R. R., & Djorgovski, S. G. 1998, AJ, 116, 1606 [NASA ADS] [CrossRef] [Google Scholar]
- Papovich, C., Bassett, R., Lotz, J. M., et al. 2012, ApJ, 750, 93 [NASA ADS] [CrossRef] [Google Scholar]
- Peng, C. Y., Ho, L. C., Impey, C. D., & Rix, H.-W. 2002, AJ, 124, 266 [NASA ADS] [CrossRef] [Google Scholar]
- Peng, C. Y., Ho, L. C., Impey, C. D., & Rix, H.-W. 2010, AJ, 139, 2097 [NASA ADS] [CrossRef] [Google Scholar]
- Postman, M., Franx, M., Cross, N. J. G., et al. 2005, ApJ, 623, 721 [NASA ADS] [CrossRef] [Google Scholar]
- Postman, M., Coe, D., Benítez, N., et al. 2012, ApJS, 199, 25 [NASA ADS] [CrossRef] [Google Scholar]
- Poulain, P., Nieto, J.-L., & Davoust, E. 1992, A&AS, 95, 129 [NASA ADS] [Google Scholar]
- Prugniel, P., & Simien, F. 1996, A&A, 309, 749 [NASA ADS] [Google Scholar]
- Raichoor, A., & Andreon, S. 2012, A&A, 543, A19 [NASA ADS] [CrossRef] [EDP Sciences] [Google Scholar]
- Saglia, R. P., Bender, R., & Dressler, A. 1993a, A&A, 279, 75 [NASA ADS] [Google Scholar]
- Saglia, R. P., Bertschinger, E., Baggley, G., et al. 1993b, MNRAS, 264, 961 [NASA ADS] [CrossRef] [Google Scholar]
- Saglia, R. P., Sánchez-Blázquez, P., Bender, R., et al. 2010, A&A, 524, A6 [NASA ADS] [CrossRef] [EDP Sciences] [Google Scholar]
- Sánchez, S. F., Cardiel, N., Verheijen, M. A. W., Pedraz, S., & Covone, G. 2007, MNRAS, 376, 125 [NASA ADS] [CrossRef] [Google Scholar]
- Sandage, A. 1972, ApJ, 173, 485 [NASA ADS] [CrossRef] [Google Scholar]
- Santos, J. S., Fassbender, R., Nastasi, A., et al. 2011, A&A, 531, L15 [NASA ADS] [CrossRef] [EDP Sciences] [Google Scholar]
- Saracco, P., Casati, A., Gargiulo, A., et al. 2014, A&A, 567, A94 [NASA ADS] [CrossRef] [EDP Sciences] [Google Scholar]
- Sirianni, M., Jee, M. J., Benítez, N., et al. 2005, PASP, 117, 1049 [NASA ADS] [CrossRef] [Google Scholar]
- Smith, R. J., Lucey, J. R., & Carter, D. 2012, MNRAS, 421, 2982 [NASA ADS] [CrossRef] [Google Scholar]
- Stalder, B., Ruel, J., Šuhada, R., et al. 2013, ApJ, 763, 93 [NASA ADS] [CrossRef] [Google Scholar]
- Stanford, S. A., Brodwin, M., Gonzalez, A. H., et al. 2012, ApJ, 753, 164 [NASA ADS] [CrossRef] [Google Scholar]
- Terlevich, A. I., Caldwell, N., & Bower, R. G. 2001, MNRAS, 326, 1547 [NASA ADS] [CrossRef] [Google Scholar]
- Thomas, D., Maraston, C., Bender, R., & Mendes de Oliveira, C. 2005, ApJ, 621, 673 [NASA ADS] [CrossRef] [Google Scholar]
- Tran, K.-V. H., Nanayakkara, T., Yuan, T., et al. 2015, ApJ, 811, 28 [NASA ADS] [CrossRef] [Google Scholar]
- Treu, T., Ellis, R. S., Liao, T. X., et al. 2005, ApJ, 633, 174 [NASA ADS] [CrossRef] [Google Scholar]
- Treu, T., Schmidt, K. B., Brammer, G. B., et al. 2015, ApJ, 812, 114 [NASA ADS] [CrossRef] [Google Scholar]
- van der Wel, A., Rix, H.-W., Wuyts, S., et al. 2011, ApJ, 730, 38 [NASA ADS] [CrossRef] [Google Scholar]
- van der Wel, A., Franx, M., van Dokkum, P. G., et al. 2014, ApJ, 788, 28 [NASA ADS] [CrossRef] [Google Scholar]
- van Dokkum, P. G. 2001, PASP, 113, 1420 [NASA ADS] [CrossRef] [Google Scholar]
- van Dokkum, P. G., & Franx, M. 2001, ApJ, 553, 90 [Google Scholar]
- van Dokkum, P. G., Whitaker, K. E., Brammer, G., et al. 2010, ApJ, 709, 1018 [NASA ADS] [CrossRef] [Google Scholar]
- Webb, T., Noble, A., DeGroot, A., et al. 2015, ApJ, 809, 173 [NASA ADS] [CrossRef] [Google Scholar]
- Whitaker, K. E., van Dokkum, P. G., Brammer, G., et al. 2013, ApJ, 770, L39 [NASA ADS] [CrossRef] [Google Scholar]
- Yano, M., Kriek, M., van der Wel, A., & Whitaker, K. 2016, ApJ, 817, L21 [NASA ADS] [CrossRef] [Google Scholar]
- Zeimann, G. R., Stanford, S. A., Brodwin, M., et al. 2013, ApJ, 779, 137 [NASA ADS] [CrossRef] [Google Scholar]
Appendix A: Comments on individual galaxies or clusters
In the z = 1.803 JKCS041 cluster, galaxies classified as non-early all are > 0.5 mag bluer (except one case just 0.2 mag bluer) than red-sequence galaxies in F606W−F814W. This is a common theme for all clusters, although galaxies are morphologically classified, their morphology is tightly correlated to color: non-early galaxies have blue colors.
One galaxy in the direction of the z = 1.75 IDCS J1426.5+3508 cluster is redder than red-sequence galaxies in all filters (Fig. 9), and increasingly so going toward bluer filters (e.g., 0.7 mag in F606W−F814W), making it a very likely cluster non-member. For this reason it is excluded from the sample. Furthermore, it lies at a crowded location, making the isophotal analysis of this object almost impossible.
The z = 1.71 SpARCS104922.6+564032.5 cluster is a poor cluster, only providing three red-sequence early-type galaxies.
The z = 1.63 SpARCSJ021524-034331 cluster is also a poor cluster. Its brightest galaxy (ID=1207) has a blue F105W−F140W color (Fig. 9), but a normal F814W−F105W color. A 13 ks XMM exposure (from the archive) shows no X-ray source coincident with this galaxy. Our isophotal analysis shows this galaxy to be an outlier in the mass-size relation (too small for its mass, Fig. 12) and is neglected in the mass-size fit (see Fig. 13). As for IDCS J1426.5+3508, all red-sequence non-early-type galaxies are bluer in F814W−F105W than red-sequence early-type galaxies, with no exceptions. The non-analyzable galaxy (open point in Fig. 9) is fully embedded in the brightest cluster galaxy.
Morphology and color match each other in the z = 1.58 XDCPJ0044.0-2033 cluster with only one exception.
A large nearby irregular galaxy partially hides the z = 1.48 SPT-CL2040-4451 cluster (see Fig. 5). We masked this large galaxy to improve background subtraction of the remaining part of the image.
Out of 22 early-type galaxies on the RXJ0152.7-1357 red sequence, 14 have a spectroscopic redshift and only one is outside the cluster, confirming that almost all of the analyzed galaxies are members.
Out of 24 photo-z selected early-type galaxies on the MACSJ1149.5+2223 red sequence, 2 have unfeasible isophotal analysis. Of the remaining 22 galaxies, 17 have a spectroscopic redshift and are all spectroscopically confirmed members. The size of one galaxy (a spectroscopic member) is too small for its mass, and is neglected in the mass-size fit (see Fig. 13).
As for IDCS J1426.5+3508, all the few F814W−F606W red-sequence non-early-type galaxies of Abell 2744 are bluer in F435W−F606W than red-sequence early-type galaxies, with no exceptions. Furthermore, they are all spectroscopically confirmed non-members. Of the 38 remaining galaxies, 31 have a spectroscopic redshift, and all but one are spectroscopically confirmed members. The Abell 2744 cluster is extraordinary rich and massive, which makes its core crowded. We therefore exclude from our analysis 14 early-type galaxies with largely overlapping isophotes in the very center of the cluster.
All but one galaxy in Abell 2218 has a spectroscopic redshift, and all turn out to be cluster members. A few galaxies with very overlapping isophotes at the cluster center (plus a galaxy pair) have been ignored in our isophotal analysis.
Appendix B: Half-light radius vs. scale-length
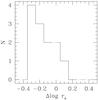 |
Fig. B.1 Size difference (ours minus literature) for 12 early-type galaxies in common between our work and Blakeslee et al. (2006). |
The half-light radius is the radius of the isophote that encloses half of the galaxy luminosity and our analysis strictly adopts this definition. As mentioned in Sect. 3.1, there is a large body of literature that uses half-light radii and that has compared different code implementations to derive it. Many recent works assume that galaxies are single-component objects, compute the azimuthally averaged radial profile and fit it with a radial profile to derive the scale-length parameter, often called effective radius (or major semi-axis) by some GALFIT (Peng et al. 2002) users. It is one of the parameters describing the shape of the azimuthally averaged radial profile and only encloses half the galaxy light for radial profile perfectly described by the assumed (Sersic) radial profile at all radii (Djorgovski & Davies 1987) and for single-component galaxies, i.e., for galaxies without any radial change in position angle or ellipticity, as also remembered by Peng et al. (2002; 2010). However, almost no galaxy fits this description, as discussed in the introduction. Because the fitted model is an oversimplified description of nature complexity, the scale-length so derived is expected to differ from the half-light radius (or semimajor axis). Instead, our half-light derivation allows the full complexity of the morphological structure seen in early-type galaxies, including ellipticity or position angle gradients. We note that although the new version of GALFIT (Peng et al. 2010) allows a multi-component fit, it has never been used in our context to our best knowledge, except Lang et al. (2014). This work shows that at least two-thirds of the galaxies in CANDELS/3D-HST requires a multi-component fit.
Given that we do not use scale-lengths in our work, a detailed study of the relative differences between half-light radius and scale-length is beyond the scope of the work. Nevertheless, RXJ0152.7-1357 early-type galaxies in our work, in Delaye et al. (2014), Blakeslee et al. (2006), and Chiboucas et al. (2009), having up to three scale-length estimates based on single-component GALFIT fits and one half-light radius, can be used to have an idea of the possible differences among these two quantities. Figure B.1 shows for 12 galaxies in common with Blakeslee et al. (2006) that scale lengths derived from azimuthally averaged profiles show a scatter with half-light radius and that are larger, on average, than half-light radii. The sign of the difference is expected because at large radii an ellipse with incorrect position angle or ellipticity intercepts more flux than an ellipse fitting the isophote. This leads to a shallower profile and therefore to larger scale-lengths (see also Lang et al. 2014). The amplitude of the systematic depends on many factors related both to the precise GALFIT setting (the three GALFIT runs return different values for some galaxies, see also Chiboucas et al. 2009) and to galaxies themselves, such as the photometric importance of the disk, and/or amplitude of the isophotal twist. Therefore, the systematic is hard to predict, making difficult to combine scale-length determinations to our half-light radii. The smaller samples in common with Delaye et al. (2014), and Chiboucas et al. (2009) (8 and 5 galaxies) confirm similar offsets. Carollo et al. (2013) derived sizes using a different software that however holds ellipticity and position angle fixed at all radii. Therefore, this work also likely shares the shortcomings of a too simple modelling.
To summarize, scale-lengths of a galaxy model that is too simple to fit the known features (e.g., gradients in ellipticity or position angle) of early-type galaxies at both high and low redshift are not half-light radii.
Appendix C: Morphological classification
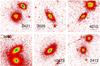 |
Fig. C.1 Remarkable cases of late-type galaxies previously classified as early-type. These galaxies have manifestly irregular or S-shaped isophotes. Top and bottom panels show examples in Delaye et al. (2014) and Blakeslee et al. (2006), respectively. The tick is 1 arcsec. The numbers are the IDs in the respective papers. |
We classify galaxies following the definitions of the morphological types. As detailed in Sect. 3, our classification returns morphologies coincident with the one derived by morphologists. Some other works sometimes adopt different morphological classes, and it may happen that galaxy populations selected in different ways also evolve in different ways.
RXJ0152.7-1357 galaxies, studied by us, Delaye et al. (2014), and Blakeslee et al. (2006), offer a sample useful to understand classification systematics. We first emphasize that Delaye et al. (2014) use a support vector machine algorithm to classify the galaxies, whereas Blakeslee et al. (2006) use morphologies from Postman et al. (2005), which are based on eye inspection and qualitative resemblance to morphological standard. We morphologically re-classify the galaxies in both the Delaye et al. (2014) and Blakeslee et al. (2006) samples, finding that the Delaye et al. (2014) sample is 50% contaminated by late-type galaxies, while the Blakeslee et al. (2006) sample is about 30% contaminated. Some remarkable examples are shown in Fig. C.1. Since the compositions of the three “early-type” samples are quite different, differences in the mass–size relation and evolution may arise. A similar morphological comparison exercise for a z = 0.4 cluster is shown in Andreon (1998), finding again that non-early-type galaxy features are sometime cumbersome to detect by visual inspection, but hard to escape by measuring isophote shapes (and also visible by eye inspection once a proper display is found, as in Fig. C.1).
The morphological complexity of the contaminating population worsen the performances in recovering half-light sizes of those programs that assume galaxies to be single components because late-type galaxies markedly differ from the single component assumed by the fitted model. Finally, the often large contamination is usually counted by authors as an additional signal rather than as contamination, spuriously overestimating the quality of their measurement.
Appendix D: Comparison with previous cluster works
Compared to literature analysis, our work displays a more extended and more homogeneous sampling of the look-back time, a larger number of analyzed clusters, and morphological classification and half-light radii determination that are more uniform and compliant to the definitions. Once considered the morphological and size caveats discussed in the previous sections, our results are consistent with the literature results, but constraining more tightly the size evolution, or differ for understood reasons detailed below.
For example, Saracco et al. (2014) find consistent mass-size relation comparing Coma and a z = 1.26 cluster, similarly to the more constraining work of Andreon et al. (2014) that has an enlarged redshift baseline. Both works lack sensitivity, being based on a handful of galaxies at high redshift, and indeed the more stringent upper limit derived in Andreon et al. (2015) is fully consistent with the change we measure in the present work.
Delaye et al. (2014), as do the previous works, sparsely sample the redshift range, with a large gap between the z ~ 0 point, taken from Huertas-Company et al. (2013) and the next point, RXJ0152.7-1357 at z = 0.83, also present in our cluster sample. They find a large evolution between these redshifts, but their claim largely relies on their choice of comparing their high-redshift very-massive clusters to a zero-redshift sample of galaxies mostly in low-mass clusters observed in shallow and low-resolution images (the Sloan Digital Sky Survey). We verified that the evidence of an evolution largely vanishes when adopting effective radii determined on deeper and better seeing images of massive nearby clusters, for example those of Coma cluster galaxies published in Saglia et al. (1993a), Jorgensen et al. (1995; 1999), and Andreon et al. (1996; 1997a,b). Papovich et al. (2012) compares instead a handful of galaxies in an high-redshift group of mass comparable to our own Galaxy (Tran et al. 2015) to a couple of massive clusters at intermediate redshift.
De Propris et al. (2016) extend their previous work (De Propris et al. 2015) on z ~ 1.25 clusters to the CLASH cluster sample however without separating galaxies in morphological classes (they use the Sersic index). Because their sensitivity is at least two times worse than our measured signal, they found no evolution at z< 0.6, consistent with the evolution we find. They found an evolution at higher redshift, but we re-emphasize the use of a different classification scheme (Sersic index vs. morphology) and the change in the morphological composition, also emphasized by the authors. Our clusters at high redshift have ≳ 5 times longer exposure times and more ditherings than those in De Propris et al. (2015), resulting in deeper images that are better sampled. In particular, dithering is paramount because many of the De Propris et al. (2015) galaxies have effective radii equal to one natural WFC3 pixel. Indeed, their z ~ 1.25 clusters are not in our sample because they have images of insufficient quality for our standards.
La Barbera et al. (2003) also find no evolution in the Kormendy relation once luminosity evolution is accounted for because of lack of sensitivity of the used data. In fact, three out of four of their clusters are at low redshift (two in
common with the present work), while the galaxies in the highest redshift cluster, at z = 0.64, have effective sizes derived from ground-based imaging, which are challenging to derive with such low-resolution data. Finally, their sample is not morphologically selected because this measurement is inaccessible from their ground images.
All Tables
Mass-size fitting parameters: intercept γ, slope α and intrinsic scatter σ for the various samples.
All Figures
|
Fig. 1 Three-color (F105W-F140W-F160W) image of the z = 1.75 IDCS J1426.5+3508 cluster. Red-sequence, early-type galaxies are marked. The late-type morphology of most galaxies cannot be appreciated in this figure and requires inspecting the full-resolution fits image. |
| In the text | |
|
Fig. 2 Three-color (F814W-F105W-F160W) image of the z = 1.71 SpARCS104922.6+564032.5 cluster. Red-sequence, early-type galaxies are marked. The late-type morphology of most galaxies cannot be appreciated in this figure. |
| In the text | |
|
Fig. 3 Three-color (F105W-F140W-F160W) image of the z = 1.63 SpARCSJ021524-034331 cluster. Red-sequence, early-type galaxies are marked. The late-type morphology of most galaxies cannot be appreciated in this figure. |
| In the text | |
|
Fig. 4 Three-color (F105W-F140W-F160W) image of the z = 1.58 XDCP J0044.0-2033 cluster. Red-sequence, early-type galaxies are marked. The late-type morphology of most galaxies cannot be appreciated in this figure. |
| In the text | |
|
Fig. 5 Three-color (F814W-F105W-F140W) image of the z = 1.48 SPT-CL J2040-4451 cluster. Red-sequence, early-type galaxies are marked. The late-type morphology of most galaxies cannot be appreciated in this figure. |
| In the text | |
|
Fig. 6 Three-color (F814W-F105W-F140W) image of the z = 1.40 ISCS J1432.3+3253 cluster. Red-sequence, early-type galaxies are marked. The late-type morphology of most galaxies cannot be appreciated in this figure. |
| In the text | |
|
Fig. 7 Three-color (F814W-F105W-F140W) image of the z = 1.32 SPT-CL J0205-5829 cluster. Red-sequence, early-type, galaxies are marked. The late-type morphology of most galaxies cannot be appreciated in this figure. |
| In the text | |
|
Fig. 8 Rest-frame wavelength sampling of the band used to derive morphologies, sizes, and masses. |
| In the text | |
|
Fig. 9 Color–magnitude plot of red-sequence early-type galaxies. The slanted rectangles indicate the selection region (± 0.2 mag from the color-magnitude relation), with H magnitude brighter than a SSP with log M/M⊙ = 10.7, both in the cluster (upper panels) and reference (bottom panels) lines of sight. Clusters are color-coded as in Fig. 8. The open points indicate galaxies within the boundaries but with unfeasible isophotal analysis. |
| In the text | |
|
Fig. 10 Mass-size relation of red-sequence early-type cluster galaxies at z> 1.47 (points color-coded, upper panel) or Coma (z = 0.0232, bottom panel). Coma cluster galaxies occupy the wedge between the two slanted lines, reported in both panels. The horizontal dotted line in the top panel indicates the PSF FWHM. Sizes are not corrected for PSF blurring effects. |
| In the text | |
|
Fig. 11 Mass distribution (left) and size distribution (right) of log M/M⊙> 10.7 galaxies of high-redshift (blue) or Coma (red) cluster galaxies. Sizes are not corrected for PSF blurring effects. To account for the different richness of compared samples, we matched the number of galaxies with masses in the lowest mass bin. The outlier with smallest effective radius reduced to log M/M⊙ = 11 is the peculiar BCG of the z = 1.63 cluster. |
| In the text | |
|
Fig. 12 Mass-size relation of red-sequence early-type cluster galaxies at z> 1. Sizes are corrected for PSF blurring effects. The solid line and shading shows the fitted mass-size relation and its 68% uncertainty (posterior highest density interval). The wedge between the two slanted lines is the locus of Coma galaxies. The horizontal dotted line indicates the PSF FWHM. |
| In the text | |
|
Fig. 13 Mass-size relation of red-sequence early-type cluster galaxies at z< 1. From top to bottom: RXJ0152.7-1357 (z = 0.84), MACSJ1149.5+2223 (z = 0.544), MACSJ1206.2-0847 (z = 0.44), Abell 2744 (z = 0.31), and Abell 2218 (z = 0.17). The relation for Coma is shown in the bottom panel of Fig. 10. Sizes are corrected for PSF blurring effects, but the correction is so small that it cannot be seen for these clusters. Points with black contours are spectroscopically confirmed galaxies. The red solid line and yellow shading show the fitted mass-size relation and its 68% uncertainty (posterior highest density interval). The wedge between the two slanted lines is the locus of Coma galaxies. The horizontal dotted line indicates the PSF FWHM (for Abell 2744 and Abell 2217 it is smaller than the displayed re range). |
| In the text | |
|
Fig. 14 Size at log M/M⊙ = 11 vs. redshift. The number above the points, when present, indicates the number of combined clusters. The solid line and shading show the fitted relation and its 68% uncertainty (posterior highest density interval). The curve indicates the evolution measured in the field by Newman et al. (2012); its absolute location is arbitrary and depends, among other things, on the adopted initial mass function and the way the population under study is selected. The almost horizontal line indicates the effect of progenitor bias on Coma galaxies. Its shading indicates the formal 68% uncertainty. The open square point is our fit of the mass-size relation using the data tabulated in Jorgensen et al. (1995; 1999) for early-type Coma galaxies. |
| In the text | |
|
Fig. 15 Age distribution of Coma early-type galaxies smaller/ average/larger for their mass. The plot is a standard box-whisker: the vertical box width delimits the 1st and 3rd quartile, while the median (2nd quartile) is indicated by the horizontal (blue) segment inside the box. The horizontal box width is the full x range of each bin, while the error bars reach the minimum/maximum in the ordinate. Observed ages can be older than the Universe age because of errors. |
| In the text | |
|
Fig. B.1 Size difference (ours minus literature) for 12 early-type galaxies in common between our work and Blakeslee et al. (2006). |
| In the text | |
|
Fig. C.1 Remarkable cases of late-type galaxies previously classified as early-type. These galaxies have manifestly irregular or S-shaped isophotes. Top and bottom panels show examples in Delaye et al. (2014) and Blakeslee et al. (2006), respectively. The tick is 1 arcsec. The numbers are the IDs in the respective papers. |
| In the text | |
Current usage metrics show cumulative count of Article Views (full-text article views including HTML views, PDF and ePub downloads, according to the available data) and Abstracts Views on Vision4Press platform.
Data correspond to usage on the plateform after 2015. The current usage metrics is available 48-96 hours after online publication and is updated daily on week days.
Initial download of the metrics may take a while.