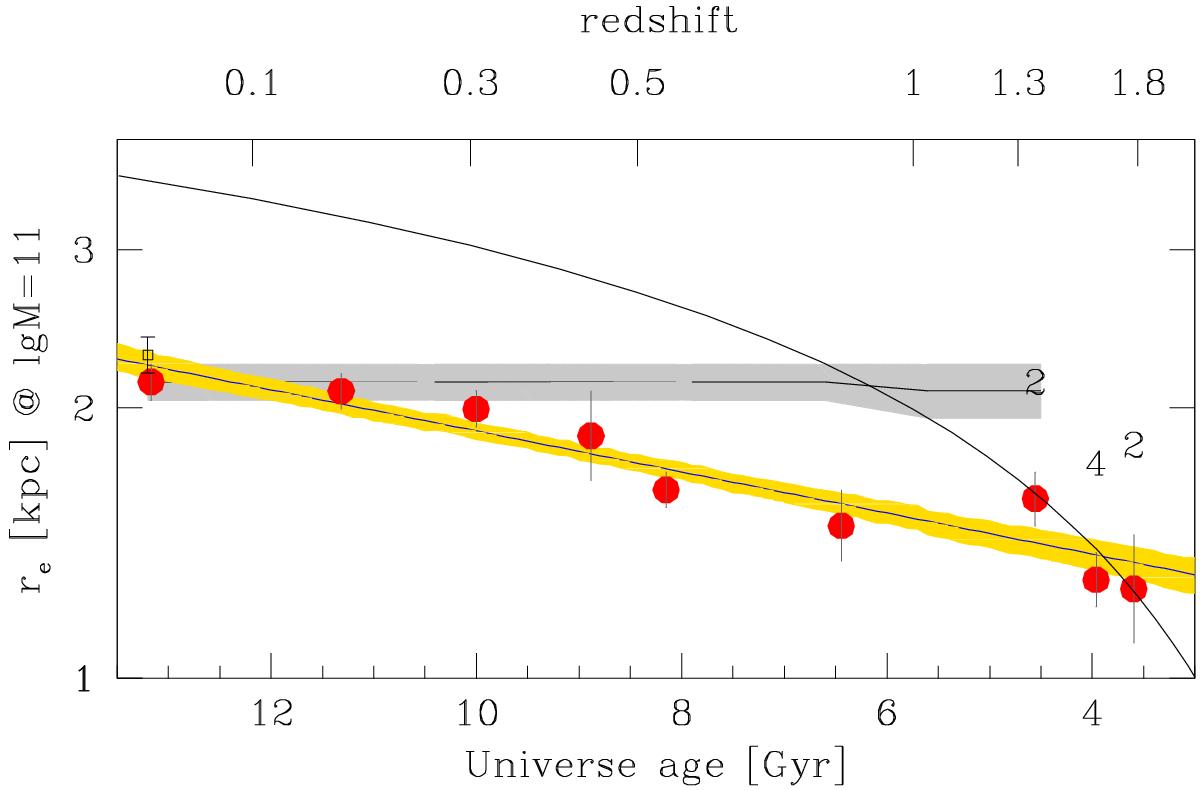
Fig. 14

Size at log M/M⊙ = 11 vs. redshift. The number above the points, when present, indicates the number of combined clusters. The solid line and shading show the fitted relation and its 68% uncertainty (posterior highest density interval). The curve indicates the evolution measured in the field by Newman et al. (2012); its absolute location is arbitrary and depends, among other things, on the adopted initial mass function and the way the population under study is selected. The almost horizontal line indicates the effect of progenitor bias on Coma galaxies. Its shading indicates the formal 68% uncertainty. The open square point is our fit of the mass-size relation using the data tabulated in Jorgensen et al. (1995; 1999) for early-type Coma galaxies.
Current usage metrics show cumulative count of Article Views (full-text article views including HTML views, PDF and ePub downloads, according to the available data) and Abstracts Views on Vision4Press platform.
Data correspond to usage on the plateform after 2015. The current usage metrics is available 48-96 hours after online publication and is updated daily on week days.
Initial download of the metrics may take a while.


