Fig. 13
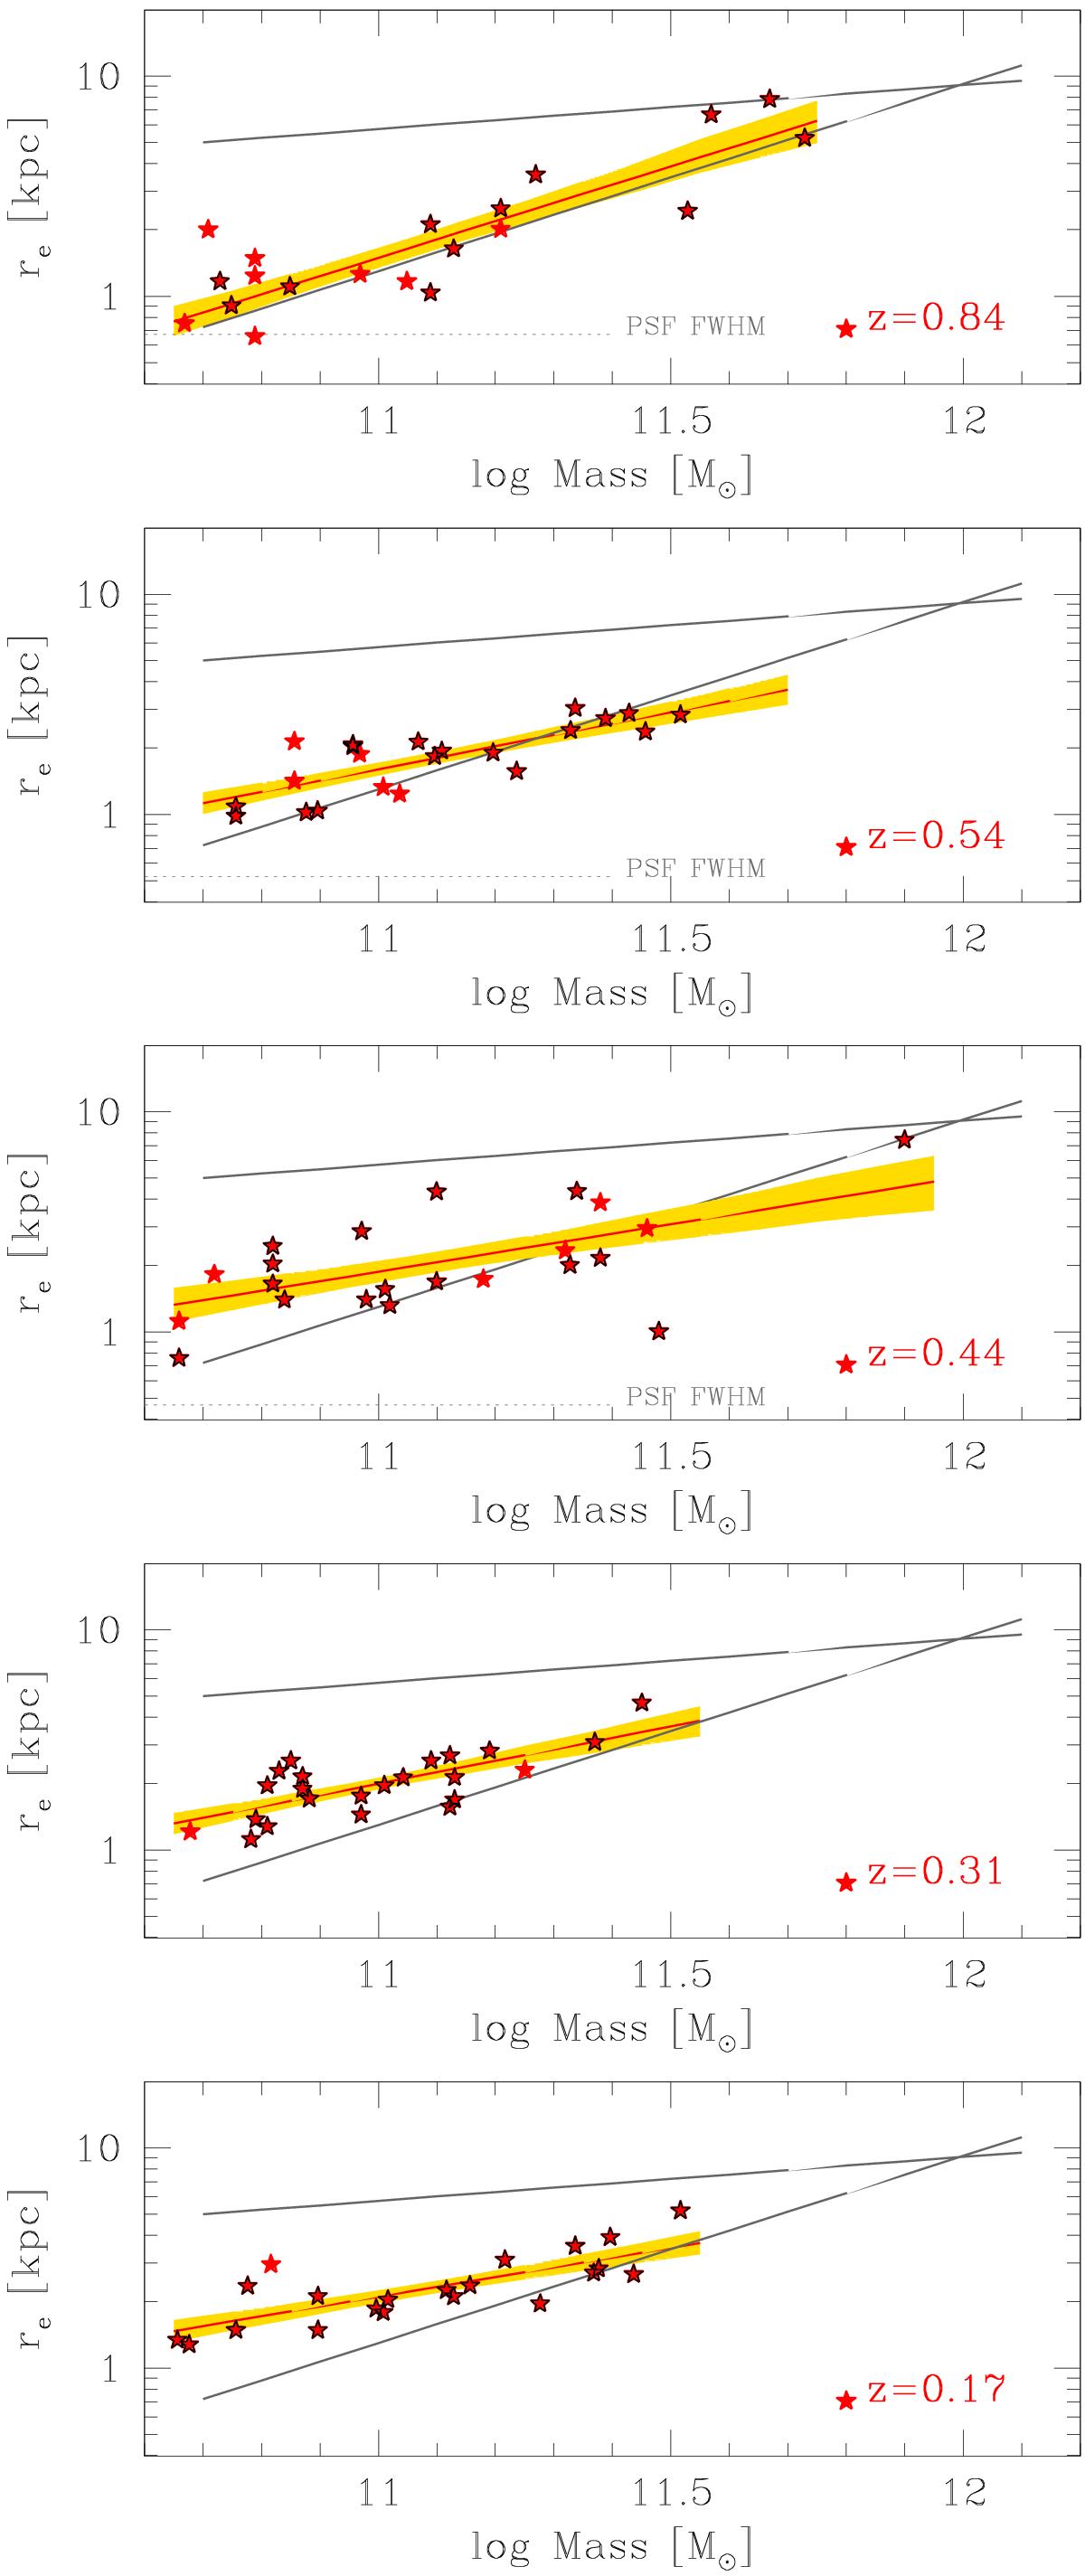
Mass-size relation of red-sequence early-type cluster galaxies at z< 1. From top to bottom: RXJ0152.7-1357 (z = 0.84), MACSJ1149.5+2223 (z = 0.544), MACSJ1206.2-0847 (z = 0.44), Abell 2744 (z = 0.31), and Abell 2218 (z = 0.17). The relation for Coma is shown in the bottom panel of Fig. 10. Sizes are corrected for PSF blurring effects, but the correction is so small that it cannot be seen for these clusters. Points with black contours are spectroscopically confirmed galaxies. The red solid line and yellow shading show the fitted mass-size relation and its 68% uncertainty (posterior highest density interval). The wedge between the two slanted lines is the locus of Coma galaxies. The horizontal dotted line indicates the PSF FWHM (for Abell 2744 and Abell 2217 it is smaller than the displayed re range).
Current usage metrics show cumulative count of Article Views (full-text article views including HTML views, PDF and ePub downloads, according to the available data) and Abstracts Views on Vision4Press platform.
Data correspond to usage on the plateform after 2015. The current usage metrics is available 48-96 hours after online publication and is updated daily on week days.
Initial download of the metrics may take a while.