Fig. 9
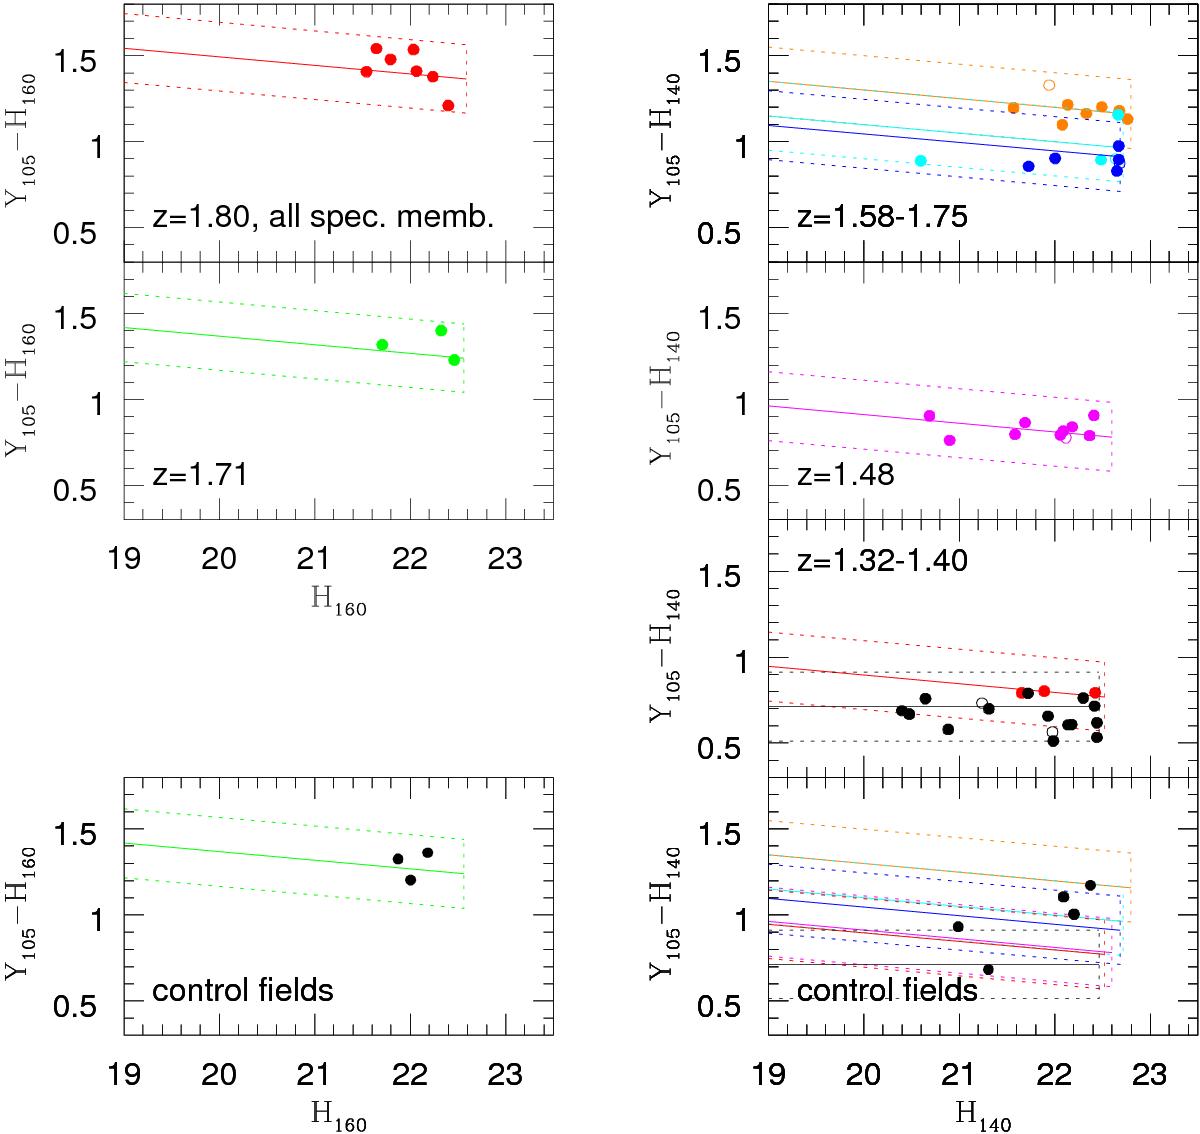
Color–magnitude plot of red-sequence early-type galaxies. The slanted rectangles indicate the selection region (± 0.2 mag from the color-magnitude relation), with H magnitude brighter than a SSP with log M/M⊙ = 10.7, both in the cluster (upper panels) and reference (bottom panels) lines of sight. Clusters are color-coded as in Fig. 8. The open points indicate galaxies within the boundaries but with unfeasible isophotal analysis.
Current usage metrics show cumulative count of Article Views (full-text article views including HTML views, PDF and ePub downloads, according to the available data) and Abstracts Views on Vision4Press platform.
Data correspond to usage on the plateform after 2015. The current usage metrics is available 48-96 hours after online publication and is updated daily on week days.
Initial download of the metrics may take a while.