| Issue |
A&A
Volume 592, August 2016
|
|
|---|---|---|
| Article Number | L10 | |
| Number of page(s) | 5 | |
| Section | Letters | |
| DOI | https://doi.org/10.1051/0004-6361/201629212 | |
| Published online | 11 August 2016 | |
Detection of millimeter-wavelength intraday variability in polarized emission from S5 0716+714
1 Korea Astronomy and Space Science
Institute, 776 Daedeok-daero,
Yuseong, Daejeon 34055, Republic of Korea
e-mail: This email address is being protected from spambots. You need JavaScript enabled to view it.
2 Department of Astronomy and Space
Science, Kyung Hee University, 1732, Deogyeong-daero, Giheung-gu, Yongin-si, Gyeonggi-do
17104, Republic of
Korea
3 University of Science and Technology,
217 Gajeong-ro,
Yuseong-gu, Daejeon
34113, Republic of
Korea
Received:
28
June
2016
Accepted:
25
July
2016
Abstract
We report the detection of millimeter-wavelength intraday variability in polarized emission from S5 0716+714 based on multifrequency polarization observations using the Korean VLBI Network (KVN) radio telescopes. The observations were conducted on November 7, 2013 at 22, 43, and 86 GHz in dual polarization using two 21 m radio telescopes belonging to KVN Yonsei and Ulsan. We found significant variations in the degree of linear polarization at 86 GHz and in polarization angle at 43 and 86 GHz during ~10 h. We measured mean flux densities of 2.8 Jy, 2.8 Jy, and 2.7 Jy at 22, 43, and 86 GHz, respectively, with a flux modulation index ranging from 1.5% to 7.2% at the frequencies. The spectrum of the source is quite flat with spectral indices of −0.07 to 0.07 at 22−43 GHz and −0.23 to 0.04 at 43−86 GHz. The measured degree of the linear polarization ranges from 2.3% to 3.3% at 22 GHz from 0.9% to 2.2% at 43 GHz and from 0.4% to 4.0% at 86 GHz, yielding prominent variations at 86 GHz over 4−5 h. The linear polarization angle is in the range of 4° to 12° at 22 GHz, −39° to 81° at 43 GHz, and 66° to 119° at 86 GHz with a maximum rotation of 110° at 43 GHz over ~4 h. We estimated the Faraday rotation measures (RM) ranging from −9200 to 6300 rad m-2 between 22 and 43 GHz, and from −71 000 to 7300 rad m-2 between 43 and 86 GHz, respectively. The frequency dependency of RM was investigated, yielding a mean power-law index, a, of 2.0. This implies that the polarized emission from S5 0716+714 at 22−86 GHz moves through a Faraday screen in or near the jet of the source.
Key words: galaxies: active / BL Lacertae objects: general / BL Lacertae objects: individual: S5 0716+714 / galaxies: jets / radio continuum: galaxies / techniques: polarimetric
© ESO, 2016
1. Introduction
Radio-loud active galactic nuclei (AGNs) have a relativistic jet emitting highly polarized synchrotron radiation that is ejected from a supermassive black hole (SMBH, MBH ≈ 106−109M⊙). Some of them have a fast flux variability on a timescale of hours to a day; this is called intraday variability (IDV; Heeschen et al. 1987). The IDV of an AGN was detected in the flux density at various wavelengths including in the centimeter (cm), millimeter (mm), and optical band (Quirrenbach et al. 1991; Wagner et al. 1996; Kraus et al. 2003; Gupta et al. 2008).
The fast flux variation in the radio regime is known to be magnified by the relativistic beaming of the jet, which is moving close to the speed of light at a small angle to the line of sight (Wagner & Witzel 1995). The IDV is commonly interpreted by intrinsic causes such as the propagation of the shock in the jet (Marscher & Gear 1985), or by extrinsic causes such as interstellar scintillation (ISS; Rickett 1998), or both. This shows that this problem is still controversially discussed. However, intrinsic mechanisms may have an important role in the IDV flux variation at mm because the ISS effect becomes weaker at mm than at cm. This indicates that simultaneous multiwavelength (including at the cm and mm) observations are very important in studying the IDV of AGNs.
In addition to the flux variations, the polarization IDV was detected at cm, yielding a larger variation amplitude in the polarized flux density than that in the total flux density (Kraus et al. 1998; Kraus et al. 2003; Fuhrmann et al. 2008). From the observations, a strong correlation was found between the polarization and the total flux density. A rapid swing of 180° for the polarization angle was observed (e.g., for 0917+624) when the flux density peaked, and this was interpreted as shock propagation in the jet (Quirrenbach et al. 1989). Kraus et al. (2003) suggested that the variation in polarization angle is explained by a multicomponent source or by anisotropic scattering in an inhomogeneous medium.
The BL Lac object S5 0716+714 (z = 0.31 ± 0.08, Nilsson et al. 2008) is a bright flat spectrum source and is well known as an IDV source. The rapid flux density variation of the source was observed mainly in the radio and optical bands (Quirrenbach et al. 1991; Wagner et al. 1996; Kraus et al. 2003; Gupta et al. 2012). A correlation of the flux variability between the radio and optical bands on timescales of days was reported by Wagner et al. (1996). A transition from a one-day timescale to a slower one-week variability timescale occurred quasi-simultaneously in radio and optical. This casts doubt on ISS as the main physical cause of IDV at least in this source. A shorter timescale of about two hours for the flux variability at 6 cm was reported by Kraus et al. (2003). For this source, studies of the polarized emission at mm and its variability are still rare, however, although it is very important to investigate the source-intrinsic mechanisms of the IDV.
To study the intraday variability in the polarized emission of the relativistic jet of S5 0716+714, we performed simultaneous multifrequency polarization observations at 22, 43, and 86 GHz during ~12 h. In this Letter, we present the results of the multifrequency simultaneous polarization observations of S5 0716+714 using the Korean VLBI Network (KVN), which enabled us to investigate the intraday variability of the polarization properties including the degree of polarization, electric vector position angle (EVPA), Faraday rotation measure (RM), and its frequency dependency, aiming at investigating the magnetic field environment of the inner regions of the relativistic jet.
2. Observations and data reduction
2.1. Observations
Observations were carried out at 22.4, 43.1, and 86.2 GHz simultaneously on November 7, 2013 (MJD 56 603−56 604) from UT 10:03 to 01:14 with the 21 m KVN radio telescopes KVN Yonsei (KY) and Ulsan (KU). From the polarization observations, the four Stokes parameters, I, Q, U, and V, were measured with the KVN digital spectrometer, which has 4096 channels across a bandwidth of 512 MHz, corresponding to a channel spacing of 125 kHz (Kang et al. 2015). Typical system temperatures, Tsys, were 85 K at 22 GHz and 177 K at 43 GHz at KY and 182 K at 86 GHz at KU. A detailed description of the KVN is provided in Lee et al. (2011). The on-source integration time per measurement was 348 s (8 scans × 16 iterations of on-off × 3 s), with an on-off switching cycle like this: OFF-ON-ON-OFF-ON-OFF-OFF-ON-ON-OFF-OFF-ON-OFF-ON-ON-OFF-ON-OFF-OFF-ON-OFF-ON-ON-OFF-OFF-ON-ON-OFF-ON-OFF-OFF-ON. To precisely measure the flux density of the source, the pointing offset correction was applied to every scan by using cross-scan observations. The time interval of the data acquisition was 40 min, including the slewing time of the antenna. We observed Jupiter, the Crab nebula, and 3C 286 as instrumental polarization calibrator, polarization angle calibrator, and standard polarization calibrator, respectively.
2.2. Data reduction
We obtained single-polarization spectra (vll∗ and vrr∗) and one cross-polarization spectrum (vlr∗ or vrl∗) from the single-dish polarimetric observations by using the KVN digital spectrometer backend. The polarization spectra were described by the four Stokes parameters, I, Q, U, and V (Sault et al. 1996). By assuming that the Stokes parameters V, Q, and U equal 0 for the non-polarized source, the D-term was removed by observing Jupiter. Then, we estimated the four Stokes parameters of 0716+714, and finally we obtained the total flux density, I, the polarization angle χ = (1 / 2) × arctan(U/Q) and the degree of linear polarization,  . These procedures were performed with the data processing software developed by Byun et al. (in prep.). We calibrated the observed polarization angles by observing the Crab nebula, whose polarization angle is 154 ± 2° (Flett & Henderson 1979; Aumont et al. 2010). Detailed procedures to reduce polarization data are described in Kang et al. (2015).
We obtained the total flux density of S5 0716+714 by converting the opacity-corrected Stokes I ( ) as
) as  , where k, η, and Ag are the Boltzmann constant, aperture efficiency, and physical area of the KVN single-dish antenna, respectively. We adopted the values of η from the KVN status reports1. The rms errors of the total flux measurements were 37 mJy, 64 mJy, and 104 mJy at 22, 43, and 86 GHz, respectively. We obtained reliable data for ~10 h (MJD = 56 603.60−56 604.00) due to the system setup or large pointing offsets (>5″) at 86 GHz.
3. Results
 |
Fig. 1 Light curves of S5 0716+714 for a) the total flux density, b) the spectral index α, c) the degree of linear polarization (%), and d) the linear polarization angle. Here, the error bars indicate 1σ of measurement error. Red, violet, and blue symbols indicate 22, 43, and 86 GHz, respectively, in panels a), c), and d). The red symbols indicate the spectral indices between 22 and 43 GHz, and the blue symbols indicate the spectral indices between 43 and 86 GHz in panel b). |
Results of the multifrequency polarization observations of S5 0716+714. Uncertainties are 1σ.
From our multifrequency polarization observations using the KVN radio telescopes, we obtained 8−11 measurements on the polarization of S5 0716+714 at 22, 43, and 86 GHz over about 10 h shown in Fig. 1 and summarized in Table 1, where all errors are 1σ errors statistically obtained from the 8-scan on-off observations. The measurements at 22 and 43 GHz were simultaneously obtained, and those at 86 GHz had time offsets of about half an hour with respect to those at 22 and 43 GHz (e.g., Fig. 1a). For parameters obtained from the measurements at 22, 43, and 86 GHz, we referred the measurement times to those of the 22 and 43 GHz measurements (e.g., Fig. 1b). From the simultaneous multifrequency polarization observations obtained at 22, 43, and 86 GHz on November 7, 2013 for S5 0716+714, we found that there were no significant intraday variations in flux densities. The flux densities Sν ranged from 2.70−2.85 Jy, 2.66−2.93 Jy, and 2.27−2.94 Jy at 22, 43, and 86 GHz, respectively. The mean flux densities ⟨Sν⟩ were 2.76 Jy, 2.76 Jy, and 2.65 Jy at 22, 43, and 86 GHz, respectively. To investigate the magnitude of the flux density variation, we estimated the modulation index m defined by Kraus et al. (2003) as m [%] = 100σs/⟨S⟩, where σs represents the standard deviation of ⟨S⟩. The modulation indices were 1.5%, 2.8%, and 7.2% at 22, 43, and 86 GHz, respectively, as summarized in Table 2. To evaluate the significance of a variability, we performed a  test as in Kraus et al. (2003). For N = 11 (22/43 GHz) and N = 8 (86 GHz) measurements, a source is considered to be variable if
  and
and  , respectively. We found that the total flux density at 43 GHz showed a marginal variability, whereas those at 22 and 86 GHz were non-variable. The spectral indices of the flux densities, α (Sν ∝ να, where ν is the observing frequency), ranged from −0.072 to 0.07 between 22 and 43 GHz and from −0.228 to −0.041 between 43 and 86 GHz. This means that the source exhibits a flat spectrum source.
The measured degree of linear polarization p is in the range of 2.3% to 3.3% at 22 GHz, 0.9% to 2.2% at 43 GHz, and 0.4% to 4.0% at 86 GHz. The modulation indices of the degree of linear polarization were 9.7%, 23.6%, and 54.3% at 22, 43, and 86 GHz, respectively. We found that p at 22 GHz marginally varied with  and p at 86 GHz significantly varied with
  , decreasing by a factor of 10 from 4.0% to 0.4% in ~4 h and then changing back to 3.9% in ~5 h. The linear polarization angle χ is in the range of 4° to 12° at 22 GHz, −39° to 81° at 43 GHz, and 66° to 119° at 86 GHz, yielding significant variations at 43 and 86 GHz with
  and 10, respectively. We found that p started to rotate first in MJD 56 603.60 at 86 GHz, and in MJD 56 603.82 at 43 GHz. The amounts of the rotation are 43° at 86 GHz, and 110° at 43 GHz. At 86 GHz, p rotates back to ~110° in MJD 56 603.78 when χ at 86 GHz is minimum. In particular, the rotation of 120° at 43 GHz occurred over ~4 h.
Results of the statistical analysis.
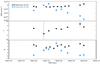 |
Fig. 2 Light curves of 0716+714 for the Faraday rotation measure RM (rad m-2) (top), the a index (middle) and the depolarization index β (bottom). In the top panel, the black symbols indicate the rotation measure between 22 and 43 GHz and the blue symbols indicate a rotation measure between 43 and 86 GHz. Measurements are shown only when the measurements at 86 GHz are available to estimate the indices a and β. In the bottom panel, β between 43 and 86 GHz is plotted at the time of 86 GHz observed by the Ulsan telescope . |
4. Discussion and conclusions
Multifrequency polarization observations of S5 0716+714 showed a polarization IDV at mm (not at cm) with non-variable total flux density. These results may be different from the cm polarization variability detected at lower frequencies by Fuhrmann et al. (2008): both total and polarized flux density varied, with the polarization variability being stronger at lower frequency and faster at higher frequency. This may imply that the Faraday rotation effect plays an important role in the polarization variability at lower frequency. A cm polarization variability was also detected by Kraus et al. (2003): the polarization variability is stronger than that of total flux density by factors of 3−8 at 10−30 GHz (Kraus et al. 2003). The relatively strong and rapid variability of the linear polarization with moderate variability in the total flux density may be explained by the combination of the variability of the multiple compact jet components differently polarized within the beam size, as discussed in Bach et al. (2006). These authors found from VLA and VLBI observations that on arcsecond scales there is no bright polarized and extended emission region. The VLA jet (on arcseconds) cannot vary so fast either because it is too extended (kpc size). This means that if a polarized multicomponent structure existed, it would have to lie within the VLBI core, which implies that the multiple components may only exist on <0.5 milliarcsecond scales. This was nicely shown by the VSOP results, which show that the rapid polarization variability may also occur in the unresolved space-VLBI core. One possible multicomponent models might be that two individual components that dominate the polarized emission in the beam have constant total flux and fractional polarization, and only their polarization angles change at the same velocity in either opposite or same direction. This may occur in a situation where two components move along a helical trajectory to the line of sight.
In addition to the 86 GHz fractional polarization variability, we also found fast rotations in the linear polarization angle: 43−110° at 43 and 86 GHz, with delays of 4−5 h. The different starting time of the rotations may indicate that the polarization angle rotation at different frequencies is related with emission regions that are spatially different. Moreover, the fast rotations in linear polarization angles with a relatively moderate change in fractional polarization may be caused by rapidly variable local external Faraday rotation (e.g., Gabuzda et al. 2000).
The polarization observations conducted simultaneously at multifrequency enabled us to accurately investigate the Faraday rotation effect on the polarized emission. Since the amount of the Faraday RM is proportional to the squares of observing wavelength (λ) as  (Jorstad et al. 2007), where χobs is the observed linear polarization angle of a source and χ0 the intrinsic polarization angle, we may expect that the polarized emission at mm (e.g., 43 and 86 GHz) experience the Faraday rotation more weakly than at cm (e.g., <22 GHz), and hence the mm observations are much more suitable for investigating the intrinsic linear polarization properties. From the multifrequency polarization observations of S5 0716+714 with KVN, we found that the RM of the polarized emission from the source is in the range from −9200 to 6300 rad m-2 between 22 GHz and 43 GHz and from −71 000 to −7300 rad m-2 between 43 GHz and 86 GHz, respectively, as shown in Fig. 2 (top panel).
These high RM values of |RM|≈6 × 10³ rad m-2−7 × 10⁴ rad m-2 at the observer frame indicate that the polarized emission of S5 0716+714 most likely traversed extragalactic Faraday screens, since Galactic RM is as low as 20 rad m-2 to the direction of the source (Taylor et al. 2009). Moreover, these high RM values are factors of 10−100 higher than those observed at 15 GHz (Hovatta et al. 2012). In addition to the rapid variation of |RM|, we found that the sign of RM changed. However, it is very difficult to change the sign of RM in a short time. The only way to change the sign would be to reverse the orientation of the magnetic field. There is no known physical mechanism that would explain the rapid intrinsic change of the field orientation. It is therefore very likely that the variation of integrated RM within the beam may be attributed to the rapidly variable local external Faraday rotation of multiple compact emission regions that are spatially different.
The frequency dependence of RM has been used to constrain the location of the Faraday screen in several previous studies (e.g., Kang et al. 2015; Lee et al. 2015; Algaba 2013; Jorstad et al. 2007; Trippe et al. 2012). By assuming that the Faraday rotation generates within or in close proximity of the jet, a simple jet model yielded a frequency dependence of RM as |RM(ν)|∝νa, where ν is the observing frequency and the power index a corresponds to the power index of the evolution of electron density in jet as ne ∝ r− a , where ne is the electron density and r is the distance of the emitting region from the central engine. For a simple jet with spherical or conical geometries, the nominal value of the index a = 2. This model constrained the location of a Faraday screen affecting the multifrequency polarization emission from a compact radio source: the Faraday screen may be located within or near the jet when the frequency dependence a of RM is close to 2. We therefore estimated the power-law index a of the RM, yielding a = −3.4 ~ 6.9 with a mean of 2.0 and an rms of 2.8, as shown in Fig. 2 (middle panel). The mean value of 2.0 implies that the Faraday screen dominantly affecting the polarized emission may be located near the jet of the source. However, due to the strong variation of a, we cannot rule out other scalings of the electron density (Contopoulos & Lovelace 1994).
To investigate the external Faraday depolarization effect of the polarized emission, we fit the degree of linear polarization at 22−43 GHz and 43−86 GHz with a power-law model p[%] = Aλβ [cm], where A is constant and λ is a observing wavelength and, β is polarization power-law index, suggested by Tribble (1991) and modified by Farnes et al. (2014). We obtained β in the range of 0.4 to 1.8 between 22 GHz and 43 GHz and −1.8 to 2 between 43 GHz and 86 GHz. The variation of β at 43−86 GHz is expected because of the large change in the degree of polarization at 86 GHz. However, the β of 0.4−1.8 at 22−43 GHz implies an inverse depolarization, that is, the degree of linear polarization at lower frequency is higher than that at higher frequency. The inverse depolarization may not be easily explained by any common external depolarization models (e.g., Hovatta et al. 2012). However, as investigated by Homan (2012), internal Faraday rotation under helical or less tangled random magnetic field configurations may explain the observed inverse depolarization at mm.
The multifrequency polarization observations of S5 0716+714 enabled us to determine that the source showed the polarization IDV at mm, which may be explained by the rapidly variable local external Faraday rotation of multiple compact emission regions that are spatially different. To the extent that the radio emission from S5 0716+714 is predominantly related with a simple jet model, we may suggest that the mm-polarized emission from the source penetrated the Faraday screen located near the jet of the source, yielding high RM of |RM|≈6 × 10³ rad m-2−7 × 10⁴ rad m-2. We expect that short mm VLBI observations may probe the detailed geometry of the magnetic field.
Acknowledgments
We would like to thank the anonymous referee for important comments and suggestions that have improved the manuscript. We are grateful to Thomas Krichbaum for careful reading and his kind comments on the manuscript. The KVN is a facility operated by the Korea Astronomy and Space Science Institute. The KVN operations are supported by the Korea Research Environment Open NETwork, which is managed and operated by the Korea Institute of Science and Technology Information. This work was supported by the National Research Foundation of Korea (NRF) grant funded by the Korea government (MSIP) (No. NRF-2016R1C1B2006697).
References
- Algaba, J. C. 2013, MNRAS, 429, 3551 [NASA ADS] [CrossRef] [Google Scholar]
- Aumont, J., Conversi, L., Thum, C., et al. 2010, A&A, 514, A70 [NASA ADS] [CrossRef] [EDP Sciences] [Google Scholar]
- Bach, U., Krichbaum, T. P., Kraus, A., Witzel, A., & Zensus, J. A. 2006, A&A, 452, 83 [NASA ADS] [CrossRef] [EDP Sciences] [Google Scholar]
- Contopoulos, J., & Lovelace, R. V. E. 1994, ApJ, 429, 139 [NASA ADS] [CrossRef] [Google Scholar]
- Farnes, J. S., Gaensler, B. M., & Carretti, E. 2014, ApJS, 212, 15 [NASA ADS] [CrossRef] [Google Scholar]
- Flett, A. M., & Henderson, C. 1979, MNRAS, 189, 867 [NASA ADS] [Google Scholar]
- Fuhrmann, L., Krichbaum, T. P., Witzel, A., et al. 2008, A&A, 490, 1019 [NASA ADS] [CrossRef] [EDP Sciences] [Google Scholar]
- Gabuzda, D. C., Kochenov, P. Y., Cawthorne, T. V., & Kollgaard, R. I. 2000, MNRAS, 313, 627 [NASA ADS] [CrossRef] [Google Scholar]
- Gupta, A. C., Cha, S.-M., Lee, S., et al. 2008, AJ, 136, 2359 [NASA ADS] [CrossRef] [Google Scholar]
- Gupta, A. C., Krichbaum, T. P., Wiita, P. J., et al. 2012, MNRAS, 425, 1357 [NASA ADS] [CrossRef] [Google Scholar]
- Heeschen, D. S., Krichbaum, T., Schalinski, C. J., & Witzel, A. 1987, AJ, 94, 1493 [NASA ADS] [CrossRef] [Google Scholar]
- Homan, D. C. 2012, ApJ, 747, L24 [NASA ADS] [CrossRef] [Google Scholar]
- Hovatta, T., Lister, M. L., Aller, M. F., et al. 2012, AJ, 144, 105 [NASA ADS] [CrossRef] [Google Scholar]
- Jorstad, S. G., Marscher, A. P., Stevens, J. A., et al. 2007, AJ, 134, 799 [NASA ADS] [CrossRef] [Google Scholar]
- Kang, S., Lee, S.-S., & Byun, D.-Y. 2015, J. Korean Astron. Soc., 48, 257 [NASA ADS] [CrossRef] [Google Scholar]
- Kraus, A., Krichbaum, T. P., & Witzel, A. 1998, in IAU Colloq. 164: Radio Emission from Galactic and Extragalactic Compact Sources, eds. J. A. Zensus, G. B. Taylor, & J. M. Wrobel, ASP Conf. Ser., 144, 277 [Google Scholar]
- Kraus, A., Krichbaum, T. P., Wegner, R., et al. 2003, A&A, 401, 161 [NASA ADS] [CrossRef] [EDP Sciences] [Google Scholar]
- Lee, S.-S., Byun, D.-Y., Oh, C. S., et al. 2011, PASP, 123, 1398 [NASA ADS] [CrossRef] [Google Scholar]
- Lee, S.-S., Kang, S., Byun, D.-Y., et al. 2015, ApJ, 808, L26 [NASA ADS] [CrossRef] [Google Scholar]
- Marscher, A. P., & Gear, W. K. 1985, ApJ, 298, 114 [NASA ADS] [CrossRef] [Google Scholar]
- Nilsson, K., Pursimo, T., Sillanpää, A., Takalo, L. O., & Lindfors, E. 2008, A&A, 487, L29 [NASA ADS] [CrossRef] [EDP Sciences] [Google Scholar]
- Quirrenbach, A., Witzel, A., Qian, S. J., et al. 1989, A&A, 226, L1 [NASA ADS] [Google Scholar]
- Quirrenbach, A., Witzel, A., Wagner, S., et al. 1991, ApJ, 372, L71 [NASA ADS] [CrossRef] [Google Scholar]
- Rickett, B. J. 1998, in IAU Colloq. 164: Radio Emission from Galactic and Extragalactic Compact Sources, eds. J. A. Zensus, G. B. Taylor, & J. M. Wrobel, ASP Conf. Ser., 144, 269 [Google Scholar]
- Sault, R. J., Hamaker, J. P., & Bregman, J. D. 1996, A&AS, 117, 149 [NASA ADS] [CrossRef] [EDP Sciences] [Google Scholar]
- Taylor, A. R., Stil, J. M., & Sunstrum, C. 2009, ApJ, 702, 1230 [NASA ADS] [CrossRef] [Google Scholar]
- Tribble, P. C. 1991, MNRAS, 250, 726 [NASA ADS] [CrossRef] [Google Scholar]
- Trippe, S., Neri, R., Krips, M., et al. 2012, A&A, 540, A74 [NASA ADS] [CrossRef] [EDP Sciences] [Google Scholar]
- Wagner, S. J., & Witzel, A. 1995, ARA&A, 33, 163 [NASA ADS] [CrossRef] [Google Scholar]
- Wagner, S. J., Witzel, A., Heidt, J., et al. 1996, AJ, 111, 2187 [NASA ADS] [CrossRef] [Google Scholar]
Appendix A: Instrumental and weather effects on the polarization observations
To prove that the observed rapid polarization variability is physical and real, it would be necessary to show that nearby calibrator sources do not vary in a systematic manner. Unfortunately, we were not in a position to observe a secondary calibrator frequently enough, since one measurement takes about 40 min and hence there was a lack of the observing time. However, we observed the Crab nebula in the first and last half of the observations and found that the observed polarization angle of the Crab nebula remains constant within ~1° and ~4° at 22 and 43 GHz, respectively, at KY and ~4° at 86 GHz at KU. We also observed 3C 286 and found that p = 11.5% ± 0.2%, 12.0% ± 1.5%, and 11.3% ± 2.0% at 22, 43, and 86 GHz, respectively, and χ = 34.3° ± 0.9°, 37.8° ± 1.4°, and 45.2° ± 3.8° at 22, 43, and 86 GHz, respectively, which are consistent with the known p and χ of 3C 286 at each frequency.
To additionally evaluate possible instrumental effects on the polarization observations, we here discuss whether p and χ are correlated with some external parameters such as parallactic angle (Ψ), antenna pointing offset, and system temperatures (Tsys). From this we can determine the effect of instruments and weather on the polarization observations. First of all, during the polarization observations, the magnitudes of the D-term measured are 2% (22 GHz), 7% (43 GHz), and 1% (86 GHz) within a 512 MHz bandwidth. If there is an error in the determination of the D-term, then the D-term residual may be modulated with Ψ. Figure A.1a shows that during the polarization observations Ψ rotated from 87.4° to −99.4° at KY and from 91.5° to −95.3° at KU. There is no systematic correlation of Ψ with p and χ of the two antennas, implying that any remaining instrumental error such as the D-term determination probably does not dominate the variation of p and χ. The D-term arises mainly from the receiving system and the antenna optics. If the D-term varies in time, then it may be caused mainly by the antenna pointing offset for the antenna optics. We corrected for the antenna pointing offest in every scan, but there may be a residual offset after the correction, which may add a D-term error to be modulated with Ψ. Figure A.1b presents the antenna pointing offsets in azimuth (AZ) and elevation (EL) directions at KY and KU during the observations. However, the pointing offset again shows no prominent correlation with p and χ of each antenna. Furthermore, the typical error in p due to the antenna pointing offset of <5′′ may be as small as <0.5% at 22-86 GHz (Byun et al. in prep.). Therefore, we may rule out the instrumental effect on the strong rapid variation of p and χ. Although we found no significant variation in the total flux density, we may test whether atmospheric turbulence affect the data by investigating Tsys and optical depth (τ). Figures A.1c and d show the variation in Tsys corrected for opacity and τ in time. The atmospheric change is not strongly correlated with the total flux density. Therefore we conclude that the instrumental and weather effects on the polarization observations are very weak and do not dominate the rapid polarization variability reported here.
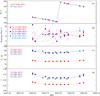 |
Fig. A.1 Plots of a) parallactic angle (°); b) antenna pointing offset (″); c) system temperature (K); and d) optical depth. |
All Tables
Results of the multifrequency polarization observations of S5 0716+714. Uncertainties are 1σ.
All Figures
|
Fig. 1 Light curves of S5 0716+714 for a) the total flux density, b) the spectral index α, c) the degree of linear polarization (%), and d) the linear polarization angle. Here, the error bars indicate 1σ of measurement error. Red, violet, and blue symbols indicate 22, 43, and 86 GHz, respectively, in panels a), c), and d). The red symbols indicate the spectral indices between 22 and 43 GHz, and the blue symbols indicate the spectral indices between 43 and 86 GHz in panel b). |
| In the text | |
|
Fig. 2 Light curves of 0716+714 for the Faraday rotation measure RM (rad m-2) (top), the a index (middle) and the depolarization index β (bottom). In the top panel, the black symbols indicate the rotation measure between 22 and 43 GHz and the blue symbols indicate a rotation measure between 43 and 86 GHz. Measurements are shown only when the measurements at 86 GHz are available to estimate the indices a and β. In the bottom panel, β between 43 and 86 GHz is plotted at the time of 86 GHz observed by the Ulsan telescope . |
| In the text | |
|
Fig. A.1 Plots of a) parallactic angle (°); b) antenna pointing offset (″); c) system temperature (K); and d) optical depth. |
| In the text | |
Current usage metrics show cumulative count of Article Views (full-text article views including HTML views, PDF and ePub downloads, according to the available data) and Abstracts Views on Vision4Press platform.
Data correspond to usage on the plateform after 2015. The current usage metrics is available 48-96 hours after online publication and is updated daily on week days.
Initial download of the metrics may take a while.