Fig. 2
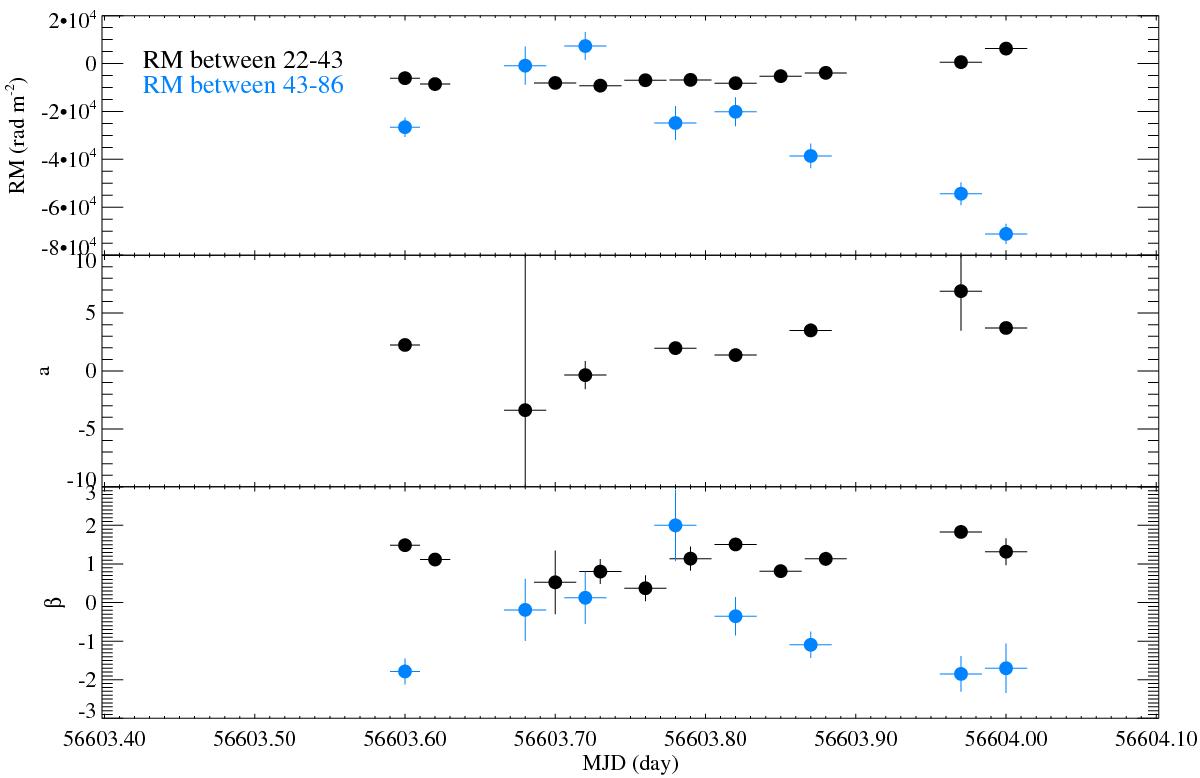
Light curves of 0716+714 for the Faraday rotation measure RM (rad m-2) (top), the a index (middle) and the depolarization index β (bottom). In the top panel, the black symbols indicate the rotation measure between 22 and 43 GHz and the blue symbols indicate a rotation measure between 43 and 86 GHz. Measurements are shown only when the measurements at 86 GHz are available to estimate the indices a and β. In the bottom panel, β between 43 and 86 GHz is plotted at the time of 86 GHz observed by the Ulsan telescope .
Current usage metrics show cumulative count of Article Views (full-text article views including HTML views, PDF and ePub downloads, according to the available data) and Abstracts Views on Vision4Press platform.
Data correspond to usage on the plateform after 2015. The current usage metrics is available 48-96 hours after online publication and is updated daily on week days.
Initial download of the metrics may take a while.