Fig. 1
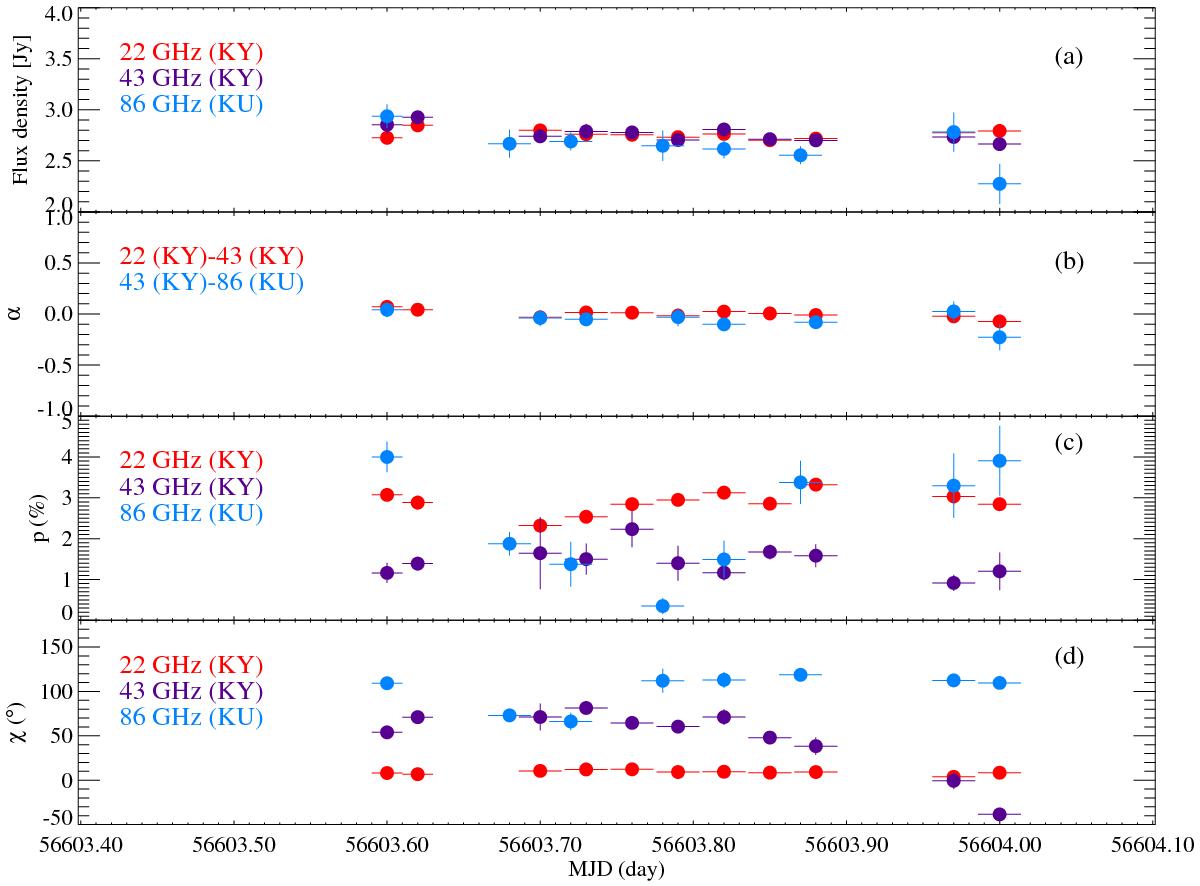
Light curves of S5 0716+714 for a) the total flux density, b) the spectral index α, c) the degree of linear polarization (%), and d) the linear polarization angle. Here, the error bars indicate 1σ of measurement error. Red, violet, and blue symbols indicate 22, 43, and 86 GHz, respectively, in panels a), c), and d). The red symbols indicate the spectral indices between 22 and 43 GHz, and the blue symbols indicate the spectral indices between 43 and 86 GHz in panel b).
Current usage metrics show cumulative count of Article Views (full-text article views including HTML views, PDF and ePub downloads, according to the available data) and Abstracts Views on Vision4Press platform.
Data correspond to usage on the plateform after 2015. The current usage metrics is available 48-96 hours after online publication and is updated daily on week days.
Initial download of the metrics may take a while.