| Issue |
A&A
Volume 592, August 2016
|
|
|---|---|---|
| Article Number | L3 | |
| Number of page(s) | 5 | |
| Section | Letters | |
| DOI | https://doi.org/10.1051/0004-6361/201628882 | |
| Published online | 25 July 2016 | |
ACA [CI] observations of the starburst galaxy NGC 253
1 IRAM, Domaine Universitaire, 300 rue de la Piscine, 38406 Saint-Martin-d’Hères, France
e-mail: krips@iram.fr
2 European Southern Observatory, Alonso de Córdova 3107, Vitacura, Santiago, Chile
3 Joint ALMA Observatory, Alonso de Córdova 3107, Vitacura, Santiago, Chile
4 Academia Sinica, Institute of Astronomy and Astrophysics, Taipei, Taiwan
5 Department of Earth and Space Sciences, Onsala Observatory, Chalmers University of Technology, 439 92 Onsala, Sweden
6 Max-Planck-Institut für Extraterrestrische Physik, Giessenbacherstr. 1, 85748 Garching, Germany
7 Department of Astronomy, University of Florida, Gainsville, FL 32611, USA
8 Department of Astronomy and Joint Space-Science Institute, University of Maryland, College Park, MD 20742, USA
9 University of Cologne, I. Physikalisches Institut, Zülpicher Str. 77, 50937 Köln, Germany
10 Scuola Normale Superiore, Piazza dei Cavalieri 7, 56126 Pisa, Italy
11 Observatorio de Madrid (OAN-IGN), Alfonso XII, 3, 28014 Madrid, Spain
12 Centre for Astrophysics Research, Science & Technology Research Institute, University of Hertfordshire, Hatfield AL109 AB, UK
13 Department of Physics and Astronomy, UCL, Gower St., London, WC1E 6BT, UK
14 Department of Astronomy, University of Massachusetts-Amherst, Amherst, MA, USA
15 NRAO, 520 Edgemont Rd., Charlottesville, VA 22903, USA
16 SKA Organziation, Lower Withington Macclesfield, Cheshire SK11 9DL, UK
Received: 9 May 2016
Accepted: 24 June 2016
Context. Carbon monoxide (CO) is widely used as a tracer of the molecular gas in almost all types of environments. However, several shortcomings of CO complicate usaging it as H2 tracer, such as its optical depth effects, the dependence of its abundance on metallicity, or its susceptibility to dissociation in highly irradiated regions. Neutral carbon emission has been proposed to overcome some of these shortcomings and hence to help revealing the limits of CO as a measure of the molecular gas.
Aims. We aim to study the general characteristics of the spatially and spectrally resolved carbon line emission in a variety of extragalactic sources and evaluate its potential as complementary H2 tracer to CO.
Methods. We used the Atacama Compact Array to map the [CI](3P1–3P0) line emission in the nearby starburst galaxy NGC 253 at unprecedented angular resolution (~3′′). This is the first well-resolved interferometric [CI] map of an extragalactic source.
Results. We have detected the [CI] line emission at high significance levels along the central disk of NGC 253 and its edges where expanding shells have previously been found in CO. Globally, the distribution of the [CI] line emission strongly resembles that of CO, confirming the results of previous Galactic surveys that [CI] traces the same molecular gas as CO. However, we also identify a significant increase of [CI] line emission with respect to CO in (some of) the outflow or shocked regions of NGC 253, namely the bipolar outflow emerging from the nucleus. A first-order estimate of the [CI] column densities indicates abundances of [CI] that are very similar to the abundance of CO in NGC 253. Interestingly, we find that the [CI] line is marginally optically thick within the disk.
Conclusions. The enhancement of the [CI]/CO line ratios (~0.4−0.6) with respect to Galactic values (≤0.1), especially in the shocked regions of NGC 253, clearly indicates that mechanical perturbation such as shocks and the strong radiation fields in this starburst galaxy have a marked effect on the carbon excitation and/or abundance.
Key words: galaxies: active / submillimeter: galaxies / galaxies: ISM / galaxies: starburst / galaxies: individual: NGC 253
© ESO, 2016
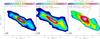 |
Fig. 1 Velocity-integrated maps of the [CI](3P |

1. Introduction
The feeding of, and feedback from, starbursts (SB) or supermassive black holes (AGN) in the central regions of galaxies are complex physical processes that vary with the evolutionary stage of and environmental conditions within the respective host galaxy. Detailed studies of the dynamics, spatial distribution, excitation conditions, and chemistry of the main constituents of the fueling material, the molecular, atomic, and ionized gas, are an indispensible tool for understanding the underlying physical mechanisms. The recent availability of ALMA’s band 8 opens up a new era of studying the gas through neutral atomic carbon (C) emission in nearby galaxies (using its fine-structure lines [CI]) at an unprecedented high angular and spectral resolution, an H2 tracer that is potentially comparable in strength to carbon monoxide (CO; e.g., Stutzki et al. 1997; Weißet al. 2003, 2005; Papadopoulos & Greve 2004; Walter et al. 2011; Offner et al. 2014). Contrary to expectations from homogeneous cloud models (see, e.g., Hollenbach & Tielens 1999), observations demonstrate that C is not only constrained to a layer interfacing the ionized outer regions (dominated by ionized carbon) and the shielded cores (CO dominated), but one that is well mixed throughout the clouds (e.g., Keene et al. 1996; Ikeda et al. 2002; Shimajiri et al. 2013). This is thought to be a consequence of the timescale of several Myr for the chemical formation of C to CO, which is similar to the dynamical timescales (see Suzuki et al. 1992; Lee et al. 1996) and density inhomogeneities created by turbulences (e.g., Glover et al. 2015). Especially in active environments, the dissociation of C-bearing molecules such as CO by the strong radiation fields, either in the form of UV-radiation from an SB, X-rays from an AGN, or cosmic rays from a supernova as well as mechanical processes through shocks, can significantly enhance the C abundance (e.g., Hollenbach & Tielens 1999; Tanaka et al. 2011; Meijerink et al. 2011; Bisbas et al. 2015). Single-dish observations have demonstrated that [CI]/CO ratios are significantly higher in active environments than in Galactic clouds (e.g., Stutzki et al. 1997; Israel et al. 1995; Israel 2009; Walter et al. 2011). Among others, the low critical densities (ncrit = 3 × 103 cm-3; e.g., Kaufman et al. 1999) of its ground-state line makes C as easily excited as CO in molecular clouds. All this promotes C as a complementary H2 tracer to CO, especially in active galaxies. However, the possible “superiority” of C to CO, as a tracer of H2, has been questioned by Israel et al. (2015), who found a poor correlation in a large survey of Ultra-Luminous Infra-Red Galaxies (ULIRGs). The [CI] line emission in their sources seems to be mostly associated with dense and not with diffuse gas and depends strongly on the excitation conditions.
This is the first publication in a series of C studies presenting observations of high angular resolution and high sensitivity of the [CI] emission in nearby active galaxies. In this Letter, we concentrate on the nearby (3.5 Mpc, where 1′′ = 17 pc (see Mouhcine et al. 2005; Rekola et al. 2005) starburst galaxy NGC 253 (for more details see Sakamoto et al. 2011; Bolatto et al. 2013; Krips et al. 2016).
2. Observations
The observations of the neutral atomic carbon fine-structure line emission ([CI](3P1–3P0) in the nearby starburst galaxy NGC 253 were carried out on July 26 2015 with the Atacama Compact Array (ACA) as part of the ALMA project 2013.1.00368.S in Cycle 2. The line transition is at a rest frequency of 492.161 GHz, and we refer to it as [CI](1−0) in the following. No ALMA 12 m array observations were carried out because of weather constraints, but the ACA observations are of such a good quality and angular resolution by themselves that they warrant publication.
The ACA observations were carried out with 11 antennas that were spaced at uv-distances ranging between ~8 m up to 50 m and hence recovering large-scale structures up to ~15′′. This gives a synthesized beam of 3 11 at a position angle of 80 degrees at 492 GHz (natural weighting). In total, 22 mosaic fields were placed along the central ~80′′ × 80′′ of NGC 253; the field of view of each individual mosaic field amounts to ~21′′. The on-source time corresponds to three hours in total, split into eight to ten minutes per field. Four spectral windows were centered on the following observed frequencies: 491.772 GHz ([CI](1−0)) and 489.905 GHz in the upper sideband, and 479.521 GHz and 477.884 GHz in the lower sideband, with an initial spectral resolution of 1.9053 MHz (≡1.19 km s-1) and a total bandwidth of 1.99 GHz each. The data were subsequently sampled to a lower spectral resolution of 4.88 MHz (≡2.98 km s-1). We used Neptune as absolute flux, J2253+1608 as bandpass, and J0038-2459 as gain (amplitude and phase-in-time) calibrators. There were no signs of line emission or absorption in Neptune in any of the observed spectral windows, and we used the planetary model defined in the Butler-JPL- Horizons 2012 catalog. Average system temperatures were between 300 and 600 K at 480 GHz-490 GHz. We reached an rms noise level of ~150 mJy in 3 km s-1 wide velocity channels for the spectral window centered on 492 GHz. We reduced the data with the ALMA CASA package (version 4.3.1; McMullin 2007) but performed subsequent processing with the GILDAS package1.
The continuum emission was derived from all line-free channels (i.e., excluding the [CI] and the marginally detected CS line emission) and subsequently subtracted from the uv-visibilities in all channels to create continuum-free line data cubes. The positions agree well with those extracted from the CO(J = 1−0) data cube, indicating accurate astrometry for both data sets within the errors.
ALMA 12 m array cycle 0 observations are available for the CO(J = 1−0) line emission from the ALMA science archive (2011.0.00172.S; see Bolatto et al. 2013). The compact configuration used for these observations corresponds well to the scales covered with the ACA [CI] observations of ≤20′′; the spectrally resolved line emission shows scales of ≤10′′ so that no different resolution effects are expected. Given also the excellent uv-coverage, we used a slight uv-taper to smooth the initial angular resolution to that of our [CI](1−0) observations.
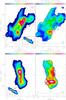 |
Fig. 2 Position-velocity diagram of the [CI](1−0) line emission (color scale) taken along the disk (upper panels a+b) and perpendicular to it (lower panels c+d; the slices are chosen such as that they go through the maximum peak of the line ratio map shown in Fig. 1c). The CO(J = 1−0) line emission (contours) is overlaid on that of [CI] in panels a) and c); the velocity resolution is 3 km s-1. Panels b) and d) show the [CI](1−0)/CO line ratio map in brightness temperature scale overlaid with contours of the [CI] emission. The contours of the CO(J = 1−0) line emission are in steps of 30σ (1σ = 7.4 mJy/beam) in panel a) and c) and that of the [CI] emission goes in steps of 7σ (1σ = 150 mJy/beam) in panel b) and in steps of 5σ in panel d). The zero velocity corresponds to the kinematic LSR velocity of 236 km s-1. |
3. Results and discussion
The [CI](1−0) line emission is clearly detected throughout the circumnuclear disk of NGC 253. In both peak location and distribution, it strongly resembles the CO line emission (see Fig. 1 as well as Sakamoto et al. 2011; Bolatto et al. 2013; Krips et al. 2016). The [CI](1−0) line emission shows the strongest peak at what is believed to be the center of NGC 253 (see Turner & Ho 1985; Sakamoto et al. 2011; Müller-Sánchez et al. 2010), which also coincides with one of the (sub-)millimeter continuum and CO line peaks. Compared to single-dish [CI](1−0) line emission spectra observed in NGC 253 (Israel et al. 1995), we have probably resolved out less than 20% of the [CI](1−0) line emission in the central ~50′′ with our ACA observations. This is on the order of the absolute flux calibration uncertainties between the two observations.
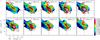 |
Fig. 3 Channel maps of the [CI](1−0)/CO(J = 1−0) line ratios in Tmb-scale (color scale) between velocities −40 km s-1 and −94 km s-1 overlaid with the integrated [CI](1−0) line emission (contours); the color scales starts from 0.09 and go in steps of 0.3, the contours of [CI](1−0) start at 5σ and go in steps of 10σ (1σ=106mJy/beam). Note that the velocity resolution has been resampled to 6 km s-1. |
The spectrally integrated line ratios between the [CI](1−0) and CO(J = 1−0) line emission are plotted in brightness temperature scale in Fig. 1c. The line ratios are mostly ~0.2−0.3 within the disk with a very pronounced absolute maximum of almost 0.4, which is located a few arcseconds NW of the central part of the disk. X-ray, Hα and CO(J = 1−0) emission maps reveal a strong outflow in the same NW direction (see Bolatto et al. 2013). To assess whether the spectrally integrated maps hide further details and/or velocity-dependent structures, we derived position-velocity diagrams for the [CI](1−0) and CO(J = 1−0) line emission along and perpendicular to the disk in NGC 253 (see Figs. 2a and c). We also calculated the line ratios in temperature scale for the two velocity slices (see Figs. 2b and d). In addition to the pronounced global maximum toward the NW that is only marginally captured with the chosen slice along the disk we find an even stronger local line ratio peak of almost 0.6 that is located between the center and the western edge of the disk. It extends over roughly 50 km s-1 so it is averaged out in the line ratio map of Fig. 1, which was spectrally integrated over a much wider velocity range (~400 km s-1). Figure 3 shows the channel maps of the line ratios between velocities of −40 km s-1 and −94 km s-1 to indicate where this line ratio peak is located within the disk and how it behaves dynamically. Although Fig. 1 suggests that the higher [CI](1−0)/CO(J = 1−0) line ratio only extends in NW direction perpendicular to the disk, the region of the highest ratios is also extended within the disk in the western as well as south-eastern direction (Fig. 2). The outflow is known to be bipolar (see Bolatto et al. 2013), therefore we would expect to find similar ratios on both sides of the outflow if the shock itself were the cause of this phenomenon. The extension to the west is less clear, although an interaction might be taking place between the central outflow and the western edge where an expanding shell is suspected (see Sakamoto et al. 2011; Bolatto et al. 2013; Krips et al. 2016). Although we see a bipolarity of the increased line ratios in the velocity-resolved maps, we cannot completely exclude a possible shadowing (i.e., optical thickness effect) of the CO(J = 1−0) line emission in the NW part of the outflow by the disk whose near-side is the NW part (see Sakamoto et al. 2006, 2011) because of the asymmetry in the line ratios between the NW and SE parts. The shadowing by the disk could artificially decrease the CO(J = 1−0) emission and hence increase the [CI](1−0)/CO(J = 1−0) line ratio there. However, the fact that we see a similar though less pronounced trend in the line ratios toward the SE part of the outflow probably indicates that the shadowing might only magnify the effect in the NE part, which would explain the asymmetry of this bipolarity. Furthermore, the findings by Krips et al. (2016) suggest that the high [CI](1−0)/CO(J = 1−0) ratio of ≳0.4 is not due to a temperature and hence a less excited CO(J = 1−0) line must be due to an abundance effect (either in C and/or CO). A very early paper on [CI](1−0) emission by Little et al. (1998) has reported on higher [CI](1−0)/CO(J = 1−0) ratios of ≃0.4 in the bipolar outflow of the Galactic molecular cloud G5.2-0.74N. The authors argued that the CO emission had been dissociated by far-UV radiation from the central source in the cavity of the outflow, hence reducing the CO abundance and probably at the same time increasing that of C (see also Offner et al. 2014; Tanaka et al. 2011).
The simulations by Kaufman et al. (1999) showed that the CI[1-0]/CO(J = 1−0) line ratios increase with decreasing densities in photon-dominated regions (PDR). For the line ratios of 0.2-0.3 along the disk, densities of ~104cm-3 predicted by their models are mostly consistent with those calculated from previous LVG simulations in NGC 253 (e.g., Krips et al. 2016); the disk in NGC 253 is thought to be dominated by PDRs (e.g., Martín et al. 2009). If the entire gas emission in NGC253 is simply due to PDR excitation or chemistry alone, the increase to 0.5−0.6 to the NW and SE found in our observations might then be a simple density effect. However, if this were true, we would expect higher ratios toward the eastern part of the disk as well, that is, everywhere where we expect the density to fall, but this is not the case. Moreover, the good agreement between the peak of the line ratio and the outflow from the disk imply that shocks could be an additional factor for the increased line ratios here.
3.1. Opacities, column densities, and C/CO abundance ratios
We cannot a priori assume optically thin emission for the [CI](1−0) line emission, therefore we start by estimating its optical depth. Following the approach used by Ikeda et al. (2002) and Glover et al. (2015), we estimated the [CI](1−0) opacity from the excitation temperature derived from the optically thick CO(J = 1−0) line emission as a first approximation, assuming that the excitation temperatures are identical for CO and C and that they coexist in the same gas regions. We find excitation temperatures of Tex,CO ≃ 7−13 K (≡Tex,C) along the disk of NGC 253, which is consistent with the range stated in Meier et al. (2015), and [CI](1−0) opacities of τ[ CI ] ≃ 0.8−0.9. The [CI](1−0) line emission is marginally optically thick. This translates into an optical depth correction factor of fτ ≃ 1.5 that has to be applied to the carbon column densities (fτ = 1 corresponds to the optically thin case). Using the specific parameters for the [CI](1−0) line such as the Einstein A coefficient of 7.9 × 10⁻⁸ s-1 (see Nussbaumer 1971) and integrated fluxes of 300 to 1620 Jy/beam km s-1 ( ) pc) along the disk of NGC 253, we find column densities of NC = fτ × 1.429 × 10¹⁵∫S(Jy)dv/[Jy km s-1]cm-2 ≃ (1−3) × 1018 cm-2 (for a more detailed description of the formulae see Ikeda et al. 2002). These carbon column densities are significantly higher by a factor of ~5−10 than those found in the Galactic center and several Galactic star forming molecular clouds (e.g., Tanaka et al. 2011; Plume et al. 1999) and lie at the upper end of the values found for turbulent molecular cloud models (Glover et al. 2015). They are also similar to the (averaged) column densities of NCI/dv ≃ 1018 cm-2/(km s-1) derived for the C survey of (U)LIRGs by Israel et al. (2015), who used a large-velocity-gradient (LVG) modeling and single-dish observations.
Krips et al. (2016) performed an LVG analysis using several CO transitions and a two-phase temperature model of the molecular gas to determine CO column densities NCO of a few times 1018 cm-2 (see also Meier et al. 2015). The best-fit CO column densities then indicate a NCI/NCO ratio, or more directly, an abundance ratio [C]/[CO] of ~0.5−1, which is higher by a factor of ~5−10 than the average found in Israel et al. (2015), but within their range for all galaxies. Thus, C seems to be almost as abundant as CO in NGC 253.
4. Summary and conclusions
Significant [CI](1−0) emission is detected in the central ~1 kpc of the starburst galaxy NGC 253 with the following results:
-
1.
The [CI](1−0) line emission globally correlates well with that of CO(J = 1−0), which supports the results from previous carbon studies of Galactic sources.
-
2.
Globally, the [CI](1−0)/CO line ratios are about 0.1−0.4 in temperature scale and are therefore higher than those in the Milky Way, where values of ≤0.1 are found (e.g., Wright et al. 1991).
-
3.
The [CI](1−0) line emission appears to be enhanced compared to CO(J = 1−0) in a NW-SE direction perpendicular to the disk (along the bipolar outflow that emerges from the nucleus of NGC 253) and in the western region of the disk where outflows or shocks are important dynamical players. Galactic cloud outflows also exhibit an increase in the [CI]/CO line ratio (see Little et al. 1998; Tanaka et al. 2011). This strongly indicates that shocks and their associated radiation affect the C and/or CO excitation or abundance. However, other explanations cannot be excluded as yet, such as cosmic rays (e.g., Bisbas et al. 2015; Bradford et al. 2003), optical-depth effects, and low-density PDRs (Kaufman et al. 1999; see also discussion in Tanaka et al. 2011).
-
4.
Based on a first-order estimate of the [CI] column densities, we find carbon abundances to be almost equal to those of CO within the central disk of NGC 253. Moreover, the [CI](1−0) line emission shows opacities of around 0.8−0.9 that are not quite compatible with an optically thin gas. This agrees well with the findings by Israel et al. (2015) that C is mostly found in dense and not in diffuse gas.
Acknowledgments
K.S. was supported by the MOST grant 1092-2119-M001-011-MY3, C.F. from PRIN MIUR 2010-2011, project “The Chemical and Dynamical Evolution of the Milky Way and Local Group Galaxies”, prot. 2010LY5N2T, S.G.B. from MINECO grants AYA2013-42227-P and AYA2012-32295, S.O. from NSF grant AST-1510021, A.D.B. from NSF-AST1412419, and SM by the Ministry of Science and Technology of Taiwan with MoST 103-2112-M001-032-MY3.
References
- Bisbas, T. G., Papadopoulos, P. P., & Viti, S. 2015, ApJ, 803, 37 [NASA ADS] [CrossRef] [Google Scholar]
- Bolatto, A. D., Warren, S. R., Leroy, A. K., et al. 2013, Nature, 499, 450 [NASA ADS] [CrossRef] [PubMed] [Google Scholar]
- Bradford, C. M., Nikola, T., Stacey, G. J., et al. 2003, ApJ, 586, 891 [NASA ADS] [CrossRef] [Google Scholar]
- Glover, S. C. O., Clark, P. C., Micic, M., & Molina, F. 2015, MNRAS, 448, 1607 [NASA ADS] [CrossRef] [Google Scholar]
- Hollenbach, D. J., & Tielens, A. G. G. M. 1999, Rev. Mod. Phys., 71, 173 [Google Scholar]
- Ikeda, M., Oka, T., Tatematsu, K., Sekimoto, Y., & Yamamoto, S. 2002, ApJS, 139, 467 [NASA ADS] [CrossRef] [Google Scholar]
- Israel, F. P. 2009, A&A, 493 [Google Scholar]
- Israel, F. P., White, G. J., & Baas, F. 1995, A&A, 302, 343 [NASA ADS] [Google Scholar]
- Israel, F. P., Rosenberg, M. J. F., & van der Werf, P. 2015, A&A, 578, A95 [NASA ADS] [CrossRef] [EDP Sciences] [Google Scholar]
- Kaufman, M. J., Wolfire, M. G., Hollenbach, D. J., & Luhman, M. L. 1999, ApJ, 527, 795 [NASA ADS] [CrossRef] [Google Scholar]
- Keene, J., Lis, D. C., Phillips, T. G., & Schilke, P. 1996, IAU, 178, 129 [Google Scholar]
- Krips, M., Martín, S., Peck, A., et al. 2016, ApJ, 821, 112 [NASA ADS] [CrossRef] [Google Scholar]
- Lee, H.-H., Herbst, E., Pineau des Forets, G., Roueff, E., & Le Bourlot, J. 1996, A&A, 311, 690 [NASA ADS] [Google Scholar]
- Little, L. T., Kelly, M. L., & Murphy, B. T. 1998, MNRAS, 294, 105 [NASA ADS] [CrossRef] [Google Scholar]
- Martín, S., Martín-Pintado, J., & Viti, S. 2009, ApJ, 706, 1323 [NASA ADS] [CrossRef] [Google Scholar]
- Meier, D. S., Walter, F., Bolatto, A. D., et al. 2015, ApJ, 801, 63 [NASA ADS] [CrossRef] [Google Scholar]
- Meijerink, R., Spaans, M., Loenen, A. F., & van der Werf, P. P. 2011, A&A, 525, A119 [NASA ADS] [CrossRef] [EDP Sciences] [Google Scholar]
- McMullin, J. P., Waters, B., Schiebel, D., Young, W., & Golap, K. 2007, Astronomical Data Analysis Software and Systems XVI, eds. R. A. Shaw, F. Hill, & D. J. Bell (San Francisco, CA: ASP), ASP Conf. Ser., 376, 127 [Google Scholar]
- Mouhcine, M., Ferguson, H. C., Rich, R. M., Brown, T. M., & Smith, T. E. 2005, ApJ, 633, 810 [NASA ADS] [CrossRef] [Google Scholar]
- Müller-Sánchez, F., González-Martín, O, Férnandez-Ontiveros, J. A., Acosta-Pulido, J. A., & Prieto, M. A. 2010, ApJ, 716, 1166 [NASA ADS] [CrossRef] [Google Scholar]
- Nussbaumer, H. 1971, ApJ, 166, 411 [NASA ADS] [CrossRef] [Google Scholar]
- Offner, S. S. R., Bisbas, Th., Bell, T. A., & Viti, S. 2014, MNRAS, 440, 81 [Google Scholar]
- Papadopoulos, P., & Greve, T. 2004, ApJ, 615, L29 [NASA ADS] [CrossRef] [Google Scholar]
- Plume, R., Jaffe, D. T., Tatematsu, K., & Evans, N. J. 1999, ApJ, 512, 768 [NASA ADS] [CrossRef] [Google Scholar]
- Rekola, R., Richer, M. G., McCall, M. L., et al. 2005, MNRAS, 361, 330 [NASA ADS] [CrossRef] [Google Scholar]
- Sakamoto, K., Ho, P. T. P., Iono, D., et al. 2006, ApJ, 636, 685 [NASA ADS] [CrossRef] [Google Scholar]
- Sakamoto, K., Mao, R.-Q., Matsushita, S., et al. 2011, ApJ, 735, 19 [NASA ADS] [CrossRef] [Google Scholar]
- Shimajiri, Y., Sakai, T., Tsukagoshi, T., et al. 2013, ApJ, 774, L20 [NASA ADS] [CrossRef] [Google Scholar]
- Stutzki, J., Graf, U. U., Haas, S., et al. 1997, ApJ, 477, L33 [NASA ADS] [CrossRef] [Google Scholar]
- Suzuki, H., Yamamoto, S., Ohishi, M., et al. 1992, ApJ, 392, 551 [NASA ADS] [CrossRef] [Google Scholar]
- Tanaka, K., Oka, T., Matsumura, S., et al. 2011, ApJ, 743, L39 [NASA ADS] [CrossRef] [Google Scholar]
- Turner, J. L., & Ho, P. T. P. 1985, ApJ, 299, L77 [NASA ADS] [CrossRef] [Google Scholar]
- Walter, F., Weiß, A., Downes, D., et al. 2011, ApJ, 730, 18 [NASA ADS] [CrossRef] [Google Scholar]
- Weiß, A., Henkel, C., Downes, D., et al. 2003, A&A, 409, L41 [NASA ADS] [CrossRef] [EDP Sciences] [Google Scholar]
- Weiß, A., Downes, D., Henkel, C., & Walter, F. 2005, A&A, 429, L25 [NASA ADS] [CrossRef] [EDP Sciences] [Google Scholar]
- Wright, E. L., Mather, J. C., Bennett, C. L., et al. 1991, ApJ, 381, 200 [NASA ADS] [CrossRef] [Google Scholar]
All Figures
|
Fig. 1 Velocity-integrated maps of the [CI](3P |
| In the text | |
|
Fig. 2 Position-velocity diagram of the [CI](1−0) line emission (color scale) taken along the disk (upper panels a+b) and perpendicular to it (lower panels c+d; the slices are chosen such as that they go through the maximum peak of the line ratio map shown in Fig. 1c). The CO(J = 1−0) line emission (contours) is overlaid on that of [CI] in panels a) and c); the velocity resolution is 3 km s-1. Panels b) and d) show the [CI](1−0)/CO line ratio map in brightness temperature scale overlaid with contours of the [CI] emission. The contours of the CO(J = 1−0) line emission are in steps of 30σ (1σ = 7.4 mJy/beam) in panel a) and c) and that of the [CI] emission goes in steps of 7σ (1σ = 150 mJy/beam) in panel b) and in steps of 5σ in panel d). The zero velocity corresponds to the kinematic LSR velocity of 236 km s-1. |
| In the text | |
|
Fig. 3 Channel maps of the [CI](1−0)/CO(J = 1−0) line ratios in Tmb-scale (color scale) between velocities −40 km s-1 and −94 km s-1 overlaid with the integrated [CI](1−0) line emission (contours); the color scales starts from 0.09 and go in steps of 0.3, the contours of [CI](1−0) start at 5σ and go in steps of 10σ (1σ=106mJy/beam). Note that the velocity resolution has been resampled to 6 km s-1. |
| In the text | |
Current usage metrics show cumulative count of Article Views (full-text article views including HTML views, PDF and ePub downloads, according to the available data) and Abstracts Views on Vision4Press platform.
Data correspond to usage on the plateform after 2015. The current usage metrics is available 48-96 hours after online publication and is updated daily on week days.
Initial download of the metrics may take a while.