Fig. 1
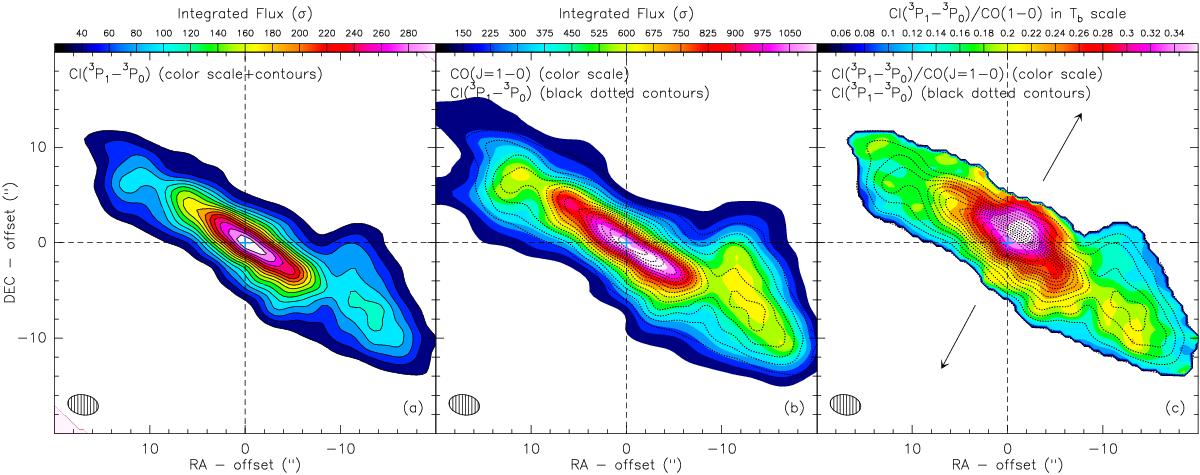
Velocity-integrated maps of the [CI](3P![]() P0) line emission (color scale and contours in panel a)), and the CO(J = 1−0) line emission of NGC 253 (color scale, panel b)). Panel c) shows the line ratio between the [CI] and CO emission in Tb scale (in color); to convert the line ratios from temperature scale into energy units (i.e., from K kms s-1 for the intensities to W m-2 sr-1), it needs to be multiplied by a factor of ~80 (≡(νCI(1−0)/νCO(1−0))3). In all panels the contours represent [CI] line emission from panel a). Contours (and/or color steps) start from 40σ to 300σ in steps of 20σ(≡108 Jy/beam km s-1 = 12 K km s-1) for panel a), from 150σ to 1200σ in steps of 75σ(≡21.6 Jy/beam km s-1 = 43 K km s-1) for panel b) (color steps), and from 0.04 to 0.36 in steps of 0.02 for panel c) (color steps). The crossing of the dashed lines in each panel marks the center of NGC 253: RA = 00h47m33s17 and Dec = −25°17′17.1′′. The synthesized beam is shown as a dashed ellipse in the lower left corner of each panel. The arrows in panel c) indicate the direction of the outflows seen in X-ray and Hα images (see, e.g., Bolatto et al. 2013).
P0) line emission (color scale and contours in panel a)), and the CO(J = 1−0) line emission of NGC 253 (color scale, panel b)). Panel c) shows the line ratio between the [CI] and CO emission in Tb scale (in color); to convert the line ratios from temperature scale into energy units (i.e., from K kms s-1 for the intensities to W m-2 sr-1), it needs to be multiplied by a factor of ~80 (≡(νCI(1−0)/νCO(1−0))3). In all panels the contours represent [CI] line emission from panel a). Contours (and/or color steps) start from 40σ to 300σ in steps of 20σ(≡108 Jy/beam km s-1 = 12 K km s-1) for panel a), from 150σ to 1200σ in steps of 75σ(≡21.6 Jy/beam km s-1 = 43 K km s-1) for panel b) (color steps), and from 0.04 to 0.36 in steps of 0.02 for panel c) (color steps). The crossing of the dashed lines in each panel marks the center of NGC 253: RA = 00h47m33s17 and Dec = −25°17′17.1′′. The synthesized beam is shown as a dashed ellipse in the lower left corner of each panel. The arrows in panel c) indicate the direction of the outflows seen in X-ray and Hα images (see, e.g., Bolatto et al. 2013).
Current usage metrics show cumulative count of Article Views (full-text article views including HTML views, PDF and ePub downloads, according to the available data) and Abstracts Views on Vision4Press platform.
Data correspond to usage on the plateform after 2015. The current usage metrics is available 48-96 hours after online publication and is updated daily on week days.
Initial download of the metrics may take a while.