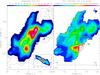
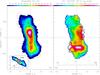
Fig. 2

Position-velocity diagram of the [CI](1−0) line emission (color scale) taken along the disk (upper panels a+b) and perpendicular to it (lower panels c+d; the slices are chosen such as that they go through the maximum peak of the line ratio map shown in Fig. 1c). The CO(J = 1−0) line emission (contours) is overlaid on that of [CI] in panels a) and c); the velocity resolution is 3 km s-1. Panels b) and d) show the [CI](1−0)/CO line ratio map in brightness temperature scale overlaid with contours of the [CI] emission. The contours of the CO(J = 1−0) line emission are in steps of 30σ (1σ = 7.4 mJy/beam) in panel a) and c) and that of the [CI] emission goes in steps of 7σ (1σ = 150 mJy/beam) in panel b) and in steps of 5σ in panel d). The zero velocity corresponds to the kinematic LSR velocity of 236 km s-1.
Current usage metrics show cumulative count of Article Views (full-text article views including HTML views, PDF and ePub downloads, according to the available data) and Abstracts Views on Vision4Press platform.
Data correspond to usage on the plateform after 2015. The current usage metrics is available 48-96 hours after online publication and is updated daily on week days.
Initial download of the metrics may take a while.