| Issue |
A&A
Volume 592, August 2016
|
|
|---|---|---|
| Article Number | A119 | |
| Number of page(s) | 9 | |
| Section | Astronomical instrumentation | |
| DOI | https://doi.org/10.1051/0004-6361/201628587 | |
| Published online | 09 August 2016 | |
Laboratory validation of the dual-zone phase mask coronagraph in broadband light at the high-contrast imaging THD testbed
1 LESIA, Observatoire de Paris, CNRS, University Pierre et Marie Curie Paris 6 and University Denis Diderot Paris 7, 5 place Jules Janssen, 92195 Meudon, France
e-mail: This email address is being protected from spambots. You need JavaScript enabled to view it.
2 Space Telescope Science Institute, 3700 San Martin Drive, 21218 Baltimore MD, USA
3 Aix-Marseille Université, CNRS, Laboratoire d’Astrophysique de Marseille (LAM), UMR 7326, 13388 Marseille, France
Received: 24 March 2016
Accepted: 26 May 2016
Abstract
Context. Specific high-contrast imaging instruments are mandatory to characterize circumstellar disks and exoplanets around nearby stars. Coronagraphs are commonly used in these facilities to reject the diffracted light of an observed star and enable direct imaging and spectroscopy of its circumstellar environment. One important property of the coronagraph is to be able to work in broadband light.
Aims. Among several proposed coronagraphs, the dual-zone phase mask coronagraph is a promising solution for starlight rejection in broadband light. In this paper, we perform the first validation of this concept in laboratory.
Methods. First, we consider the principle of the dual-zone phase mask coronagraph. Then, we describe the high-contrast imaging THD testbed, the manufacturing of the components, and the quality control procedures. Finally, we study the sensitivity of our coronagraph to low-order aberrations (inner working angle and defocus) and estimate its contrast performance. Our experimental broadband light results are compared with numerical simulations to check agreement with the performance predictions.
Results. With the manufactured prototype and using a dark hole technique based on the self-coherent camera, we obtain contrast levels down to 2 × 10⁻⁸ between 5 and 17λ0/D in monochromatic light (640 nm). We also reach contrast levels of 4 × 10⁻⁸ between 7 and 17λ0/D in broadband (λ0 = 675 nm, Δλ = 250 and Δλ/λ0 = 40%), which demonstrates the excellent chromatic performance of the dual-zone phase mask coronagraph.
Conclusions. The performance reached by the dual-zone phase mask coronagraph is promising for future high-contrast imaging instruments that aim to detect and spectrally characterize old or light gaseous planets.
Key words: instrumentation: high angular resolution / techniques: high angular resolution / planets and satellites: detection
© ESO, 2016
1. Introduction
During the past few years, high-contrast imaging instruments allowed the discovery and the spectral characterization of some objects in the outer part of extrasolar systems. Imaging circumstellar disks and exoplanets is very challenging, however, as these objects are 103 to 1010 times fainter than their host stars in the visible and near-infrared domains with angular separations smaller than 1′′ (Seager & Deming 2010).
Starlight rejection techniques are required to overcome these contrast ratios and observe circumstellar environments. In this context, coronagraphy is a powerful technique that has been adopted in current high-contrast imaging instruments, such as SPHERE/VLT (Beuzit et al. 2008), GPI/Gemini (Macintosh et al. 2008), SCExAO/Subaru (Jovanovic et al. 2014), and P1640/Palomar (Hinkley et al. 2011). These coronographic instruments can study young and massive planets that are roughtly 107 fainter than their star. The presence of advanced coronagraphs is already envisioned for the forthcoming extremely large telescopes (ELTs) on the ground and future large missions in space (e.g., WFIRST, HDST; Spergel et al. 2015; Dalcanton et al. 2015) to obtain contrast levels down to 10-10 to study cold gaseous or massive rocky planets. Coronagraphs need highly achromatic capabilities to enable the spectral analysis of disk grains and exoplanet atmospheres with reasonable exposure times. Several concepts have been proposed to observe substellar mass companions over wide spectral bands (e.g., Guyon et al. 2005; Mawet et al. 2005; Trauger et al. 2011; Galicher et al. 2011). Among these concepts, the dual-zone phase mask (DZPM) coronagraph is a promising solution that combines a pupil apodizer and a focal dual-zone phase mask to remove starlight in broadband light (Soummer et al. 2003b).
To validate the multireference self-coherent camera (MRSCC; Delorme et al. 2016), which is a focal plane wavefront sensor working in wideband, we manufactured a DZPM coronagraph for the très haute dynamique (THD; Galicher et al. 2014) testbed. We choose the DZPM because it is attractive in terms of contrast level (≈ 10-8) over a wideband (up to 40%) and it is easy to implement. Although the concept itself had never before been demonstrated, the technologies required for its manufacture had been demonstrated, both for the apodizer (Martinez et al. 2009; Sivaramakrishnan et al. 2009) and for the phase mask (N’Diaye et al. 2010a).
In this paper, we study a prototype of this device in laboratory. In Sect. 2 we describe the coronagraph principle. In Sect. 3, we present the THD testbed, detail the design of the adopted DZPM coronagraph for this testbed, and describe the manufacturing procedures for the apodizer and phase mask prototypes. In Sect. 4, we present the results of our experiment with the determination of the inner working angle (IWA) and the extinction of the DZPM, the analysis of its sensitivity to defocus, and the presentation of the contrast performance of our prototype for different spectral bandwidths up to 40%.
2. DZPM principle
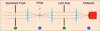 |
Fig. 1 Scheme of the coronagraphic layout. |
A phase mask coronagraph is a Lyot-style concept that involves four successive planes (A, B, C, D) represented by Fig. 1. This coronograph combines an entrance pupil with apodization in plane A, a downstream phase focal plane mask (FPM) in plane B, a Lyot stop in the relayed pupil plane C, and a detector in the final focal plane D in which the coronagraphic image of an unresolved, on-axis star is formed. The design is such that an optical Fourier transform operation relates the complex amplitudes of the electric field in two successive planes. We consider the principle of the design using circularly axisymmetrical phase FPM, first with the Roddier & Roddier phase mask (RRPM) and then with a DZPM. Soummer et al. (2003a,b) and N’Diaye et al. (2012a) provide a complete description of the mathematical formalism.
The RRPM uses a single circular phase disk that introduces a π phase shift with respect to the rest of the mask in the image plane B. The disk diameter is close to that of the Airy disk (1.06 λopt/D for a circular aperture of diameter D and design wavelength λopt). For a monochromatic source emitting at λ0, the mask creates a destructive interference within the relayed pupil, rejecting most of the stellar light outside the Lyot stop. Adding an adequate apodization in the entrance pupil plane A results in the cancellation of the electric field over the relayed pupil in plane C, and therefore leads to a perfect starlight suppression in the focal plane D (Baudoz 1999; Guyon & Roddier 2000; Soummer et al. 2003a). Unfortunately, the performance of the corresponding system strongly decreases in broadband observation. This loss of coronagraphic performance comes from chromatism effects related to the inherent properties of the RRPM.
To overcome the chromaticity issue, Soummer et al. (2003b) improved the concept by replacing the simple phase mask in the Roddier coronagraph with a DZPM. This phase mask is designed as a circular phase disk of diameter d1 surrounded by an annular phase ring of diameter d2 where d1 and d2 are on the order of the Airy disk (see Fig. 2). The DZPM introduces different phase shifts ϕ1 and ϕ2 on the incoming wavefront with respect to the rest of the phase mask in the focal plane B. These phase steps are induced by the inner and outer part of the mask and expressed in optical path differences OPD1 and OPD2. At a given central wavelength λopt, the mask creates a destructive interference within the relayed pupil, rejecting the stellar light outside the Lyot stop. An adequate choice of the DZPM parameters allows reaching destructive interferences inside the pupil over a wide range of wavelengths. One of the main parameters is the entrance pupil apodizer whose transmission follows a radially symmetric fourth order polynomial function to improve the starlight rejection (Soummer et al. 2003b). In the case of a clear aperture and with the normalized radial coordinate ρ = r/R, where r is the radial coordinate and R is the pupil radius, the amplitude apodization Φa is written as 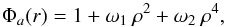 (1)with the polynomial transmission function coefficients ω1 and ω2. Further improvement is achieved by adding a slight defocus of the coronagraph mask, which is equivalent to allocating a complex term in the apodization. The phase apodization Φw at the wavelength λ is then expressed as
 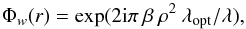 (2)with β defined from
 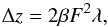 (3)where F denotes the focal ratio of the optical system and Δz the longitudinal defocus. The DZPM coronagraph involves seven parameters (ω1, ω2, β, d1, d2, OPD1, OPD2) and a careful choice of their values provides a design with a contrast better than 10-6 over 20% bandpass at an angular separation of 2 λopt/D from the star (Soummer et al. 2003b; N’Diaye et al. 2012a).
Over the past few years, DZPM prototypes were manufactured for tests in laboratory (N’Diaye et al. 2012b) but so far, they have never been introduced in a testbed with sufficiently high wavefront control performance in the low and mid-spatial frequencies to confirm the predicted performance. We decided to probe the efficiency of the DZPM coronagraph (apodizer and phase mask) by testing a recently manufactured prototype at the THD testbed at Paris Observatory.
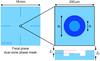 |
Fig. 2 Substract layout and mask profile. |
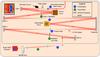 |
Fig. 3 Optical layout of the THD testbed. |
3. Experimental setup
In this section, we briefly recall the goals and main components of the optical THD testbed. Then, we present the DZPM coronagraph that was designed for this facility. Finally, we detail the manufacturing procedure and we present the metrology of the manufactured apodizer and phase mask.
3.1. THD testbed
The THD-testbed objective is the comparison of high-contrast imaging techniques under the same conditions to prepare the design of future instruments dedicated to direct imaging of exoplanets (Galicher et al. 2014). During the experiments that are presented in this paper, a Self-Coherent Camera (SCC; Baudoz et al. 2006; Galicher et al. 2008, 2010) is used as a focal plane wavefront sensor to minimize the speckle intensity in the final image by commanding a deformable mirror (DM), which is set upstream of the coronagraphic focal plane mask. A complete description of the THD testbed (Fig. 3) is given in Mas et al. (2010). In this paper, we only recall the main components.
-
The star is simulated by a monomode optical fiber that can be fedby two light sources: a quasi-monochromatic laser diode (centralwavelength λ0 = 637 nm and spectral bandwidth Δλ< 1 nm); or a Fianium supercontinuum source with calibrated spectral filters (Table 1).
-
A tip-tilt mirror is used to center the beam on the coronagraphic mask with pointing precision better than 1.5 × 10⁻³λ0/D.
-
The apodizer is set in the entrance circular unobscured pupil (diameter Øp = 8.1 mm) just after the tip-tilt mirror.
-
The DM is a 32 × 32 actuator Boston Micromachines Corporation device. It is set in a pupil plane upstream the FPM. We used 27 actuators across the pupil diameter.
-
A modified Lyot stop is used to implement the SCC. The diameter of the classical Lyot stop aperture is DL = 8 mm (98.7% filtering). The SCC reference hole is γ = 26.6 times smaller and is at a distance ξ = 1.76 DL from the Lyot stop center.
-
An Andor NEO detector is used. Images are 400 × 400 pixels and the resolution element (λ0f/DL) is sampled with 6.25 pixels.
-
An additional lens on a motorized stage enables imaging of the light distribution in the pupil plane.
We classify light sources in four categories (Table 1): monochromatic, 10 nm bandwidth, large bandwidth (<100 nm), and very large bandwidth (>200 nm). The monochromatic light source is the laser diode with no filter whereas the other light sources are produced using a combination of the supercontinuum source and one spectral filter or two (i.e., low pass and high pass). For all of our tests during the experiment, we extract 1% of the injected light on the testbed to measure and record the source spectrum. These spectra have been used in the numerical simulations presented in this paper to reproduce the experimental conditions.
Light sources used in this paper.
3.2. DZPM coronagraph
3.2.1. Design
The DZPM coronagraph aims to reject the light of an on-axis star over a wide spectral band. The prototype optimized for the THD testbed is designed to work over a bandwidth Δλ = 133 nm centered at λopt = 665 nm (Δλ/λopt = 20%). Following (N’Diaye et al. 2012a), we adjust the DZPM parameters to reach the best contrast in the coronagraphic image over an annulus ranging from 2 to 10 λopt/D from the optical axis and over the spectral band of interest. For each set of parameters, we calculate the average intensity in the annulus at five uniformly distributed wavelengths. Then, we quadratically sum the five intensities. Eventually, we use a least-squares method to find the DZPM parameters that minimize the quadratic sum. Over the spectral bandpass mentioned above, the prototype theoretically provides a contrast better than 10-6 between 2 and 10 λopt/D from the star and 3 × 10⁻⁸ at separations larger than 6 λopt/D. We also expect it to reject the stellar light down to 5 × 10⁻⁶ between 2 and 10 λopt/D and 2 × 10⁻⁷ at separations larger than 6 λopt/D over 250 nm.
The FPM parameters specified are given in Table 2 and the amplitude transmission profile of the apodizer, defined by Eq. (1) with ω1 = −0.584907 and ω2 = 0.128201. The radius of the pupil is R = 4.05 mm. The profile is plotted in Fig. 4. The throughput in intensity of the apodizer is 56% and the FWHM of the apodized PSF is 1.17 λ/D.
Dimensions of the central parts of the phase mask specified (specifications) and measured using a Wyko interferential microscope (measured dimensions).
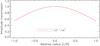 |
Fig. 4 Amplitude profile of the designed apodizer with ω1 = −0.584907 and ω2 = 0.128201. |
In Sects. 3.2.2 and 3.2.3, we describe the manufacturing procedures and our verifications of specification for both the apodizer and phase mask.
3.2.2. Apodizer characterization
The apodizer is manufactured by Aktiwave LLC (Fig. 5) using a halftone process (Dorrer & Zuegel 2007; Martinez et al. 2009; Vigan et al. 2016) to reach the required transmission function through the use of an array of microdots (5 μm by 5 μm) with a customized spatial distribution over the 8.1 mm diameter. The same manufacturing process has been used for the SPHERE (Guerri et al. 2011; Carbillet et al. 2011; Soummer 2005) and GPI (Sivaramakrishnan et al. 2010) apodizers.
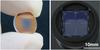 |
Fig. 5 Picture of the apodizer (left) and phase mask in its assembly (right). |
In this section we present two tests carried out on the THD testbed: the first to ensure that the apodizer amplitude profile is within the specifications and the second to measure its chromatic variation. In both cases, we record two images of the light intensity distribution in pupil plane: with and without the apodizer in the beam. Then, we divide the former by the latter and take the square root to obtain the normalized apodizer amplitude map. Finally, we derive the azimuthal average profile of this map to obtain the apodizer amplitude profile.
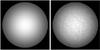 |
Fig. 6 Apodizer amplitude map: specification (left) and laser measurement (right). |
Figure 6 shows the expected apodizer amplitude map (left) and a laboratory measurement (right) obtained in monochromatic light. Dust, as well as speckles, are visible in the experimental image because of the coherence of the laser.
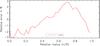 |
Fig. 7 Apodizer amplitude profile: relative difference between laser measurement and specified function (Fig. 4). |
Figure 7 shows the relative difference between the apodizer amplitude profile measured in the laser image (Fig. 6, right) and the specifications provided to the manufacturer (Fig. 4). We find a difference smaller than 3%, which includes small amplitude errors of the THD testbed and the effects of dust.
To probe the chromaticity of the apodizer, we measured the apodizer amplitude profiles for all the filters in Table 1 with bandwidth smaller than 100 nm. Figure 8 shows the relative difference between these profiles and the laser profile (derived from Fig. 6, right): 10 nm bandwidth filters centered on 620 nm (red solid curve), 647 nm (dotted green curve), 660 nm (dashed blue curve), 680 nm (dashed dotted orange curve), 30 nm bandwidth filter (dot red curve), and 80 nm bandwidth filter (dashed blue curve). For any light sources and for any radius, the relative difference is always smaller than 2.5% showing good achromaticity of our component between 600 and 685 nm.
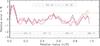 |
Fig. 8 Apodizer amplitude profile: relative error between the laser and the other filters. |
3.2.3. Phase mask characterization
The phase mask consists of two concentric cylinders shapes machined into the front face of a fused silica substrate by masking photolithography and reactive ion etching processes; see Fig. 2. This subtractive process, already experimented and optimized in the context of single zone patterns, such as the Roddier coronagraph (N’Diaye et al. 2010a, 2011) and Zernike wavefront sensors, (Dohlen et al. 2006; N’Diaye et al. 2014) have been found to be superior to the more classical additive process in which SiO2 is deposited onto a fused silica substrate (Guyon et al. 1999). Indeed, while the reactive ion etching process offers extremely steep edges and precisely defined phase steps, it is also monolithic, avoiding any interfaces between materials giving rise to spurious interference effects. The phase mask (Fig. 5) is manufactured by the SILIOS Technologies company. In the first step, a circular hole with diameter d2 and depth Z1 is generated, while in the second step, an annular hole with a depth Z2−Z1 is generated by masking the center of the first hole on the diameter d1. Its outer diameter is identical to that of the original hole (d2). Besides achieving good control of the depth of each pattern, the most critical step is the alignment of the two patterns. Any misalignment gives rise to a ridge along the edge of the outer diameter. For each manufacturing step, the mask shape is transferred into photo resist by ultraviolet (UV) insulation and chemical revelation of the resin layer, leaving the surface to be machined naked. Reactive ion etching is then applied by exposing the surface to SF6 plasma.
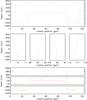 |
Fig. 9 Profile of the phase mask measured by profilometry. Top: general profile. Middle: horizontal zoom at the mask transitions. Bottom: vertical zoom on the roughness of the different mask steps. |
The excellent shape of masks made by this procedure is evident from the optical profilometery made using a Wyko interferential microscope (Fig. 9). From this profile we measure the characteristic dimensions of the phase mask defined in Sect. 2. Values obtained are included in Table 2. The dimensions of the prototype are in good agreement with our specifications showing a relative error better than 1.1% in all cases (Table 2). The root mean square (rms) roughness within the machined areas is 1.8 nm, which is identical to that of the substrate outside of the mask. While a slight rounding of the edges can be seen, the transition zone is less than 1 μm wide, which is our specification.
4. Coronagraph performance in laboratory
In this section, we present the laboratory performance of the designed DZPM that was obtained on the THD testbed. We compare the results with numerical simulations that account for most of the laboratory conditions, especially the measured apodization function (Sect. 3) and the measured source spectra.
In Sect. 4.1 we analyze the sensitivity of the DZPM coronagraph to tip-tilt and determine its inner working angle (IWA). Then, in the two following sections, we work with very high contrast in the coronagraphic image by controlling the upstream DM with the SCC (see Sect. 3.1) to generate a dark hole. In Sect. 4.2 we measure the DZPM sensitivity to defocus and finally, in Sect. 4.3 we characterize its chromatic behavior.
4.1. Inner working angle and extinction
The IWA of a coronagraphic system is defined as the off-axis distance at which the light from a stellar companion is transmitted at 50%. In this section we determine the IWA of our DZPM prototype in monochromatic light (λ0 = 637 nm). We record a series of coronagraphic images for different tips and tilts that are introduced by the tip-tilt mirror upstream from the FPM (Fig. 3). Introducing tip-tilt shifts the beam with respect to the FPM and degrades the coronagraphic attenuation. For large shifts, the FPM has no effect and we obtain noncoronagraphic images that are used to normalize the flux in the coronagraphic images. For several tips and tilts, we estimate the transmission by computing the average flux of the normalized image in a disk of 2 λ0/D radius centered on the diffraction pattern. Figure 10 plots this transmission as a function of tip-tilt. Black diamonds and green crosses represent transmission values obtained by introducing tip and tilt, respectively. We estimated the absolute pointing error at 5 × 10⁻²λ0/D. This value includes the linearity of the tip-tilt mirror, the drift during the measurement, and the precision of the image position measurement. The solid red line represents the theoretical transmission profile obtained by numerical simulations.
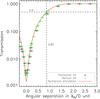 |
Fig. 10 Intensity transmission of the DZPM as function of tips (black diamonds) and tilts (green crosses) in monochromatic light (637 nm). The red curve is the function derived from numerical simulations. |
As expected, tips and tilts have the same impact. Also, the laboratory measurements are consistent with the theoretical curve. We measure an IWA of 0.85 ± 0.07 λ0/D for our DZPM prototype showing the ability of the concept to observe companions at small angular separations from the star.
From Fig. 10, in an optimal case (without tip and tilt), the DZPM extinction is 500 at 637nm. This extinction is not very high because the prototype is not optimized at 637nm but for a broadband (20%) between 2 and 10 λopt/D (see Sect. 2).
4.2. Focus sensitivity analysis
The DZPM coronagraph theoretically offers its best starlight attenuation over the separations ranging between 2 and 10 λ0/D for a slightly out-of-focus focal plane mask. We study the sensitivity of our prototype to defocus aberration.
We first put the mask at its optimal position along the optical axis to set the initial conditions for our studies. After first positioning the component at focus, we correct for phase aberrations creating a dark hole by the control of the DM with the SCC. This ensures the right focus positioning of the FPM as the best contrast to obtain after correction. Then, we introduce a defocus aberration on the deformable mirror with different amplitudes and we record two images: one coronagraphic image with the beam centered on the FPM and one noncoronagraphic image with a large tip-tilt. All images are normalized using the noncoronagraphic image at the optimized focus.
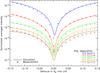 |
Fig. 11 Azimuthally averaged intensity of the DZPM coronagraphic images at different angular separations from the star as a function of a defocus term in the entrance pupil. Simulated and experimental intensities obtained in monochromatic light (637 nm) are shown as lines and points, respectively. Intensities are averaged over an annulus of 1 λ0/D width centered at a given separation. |
To estimate the amount of introduced defocus, we compute the encircled energy within the FWHM Ifwhm of the noncoronagraphic image at each focus position. Under the regime of small aberrations (2πW ≪ 1 rad, where W denotes the defocus term expressed with the Zernike coefficient for this mode), we express Ifwhm with the Strehl ratio using the Marechal expression (Ifwhm = I0exp(−(2πW)2)) to derive a theoretical relation between Ifwhm and the defocus amplitude. Using this relation, we calibrate the introduced defocus. Then, for each defocus, we measure the average intensity of the coronagraphic image at several angular separations from the central star in 1 λ0/D annuli.
The laboratory results are plotted in Fig. 11 and show good agreement with the theoretical curves. Since we deal with a phase mask coronagraph, as expected, contrast degrades quickly as absolute defocus increases. For a defocus of λ0/ 100 rms, the contrast is degraded by a factor ≈ 5 in laboratory. At the optimized focus position (null defocus), the noncorrected amplitude errors explain the discrepancies between theory and measurements at large separations.
4.3. Contrast performance in broadband light
In this section we propose two experiments to probe the performance of the DZPM prototype in terms of contrast and chromaticity.
4.3.1. Correction of phase aberrations
First, we attenuated the speckle intensity in monochromatic light inside a dark hole (DH, Fig. 12 left, gray area) that includes the full DM influence area (Fig. 12 left, dashed line). Therefore, we compensated only for the phase aberrations. Fig. 12 (right) shows the image obtained in monochromatic light.
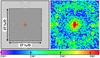 |
Fig. 12 Left: DM influence area (dashed line) and dark hole (gray area). Right: laboratory DZPM+SCC image obtained in monochromatic light (637 nm) only correcting phase aberrations. Field of view: 40 λ0/D by 40 λ0/D. The colorbar associated with this image is the same for all the coronagraphic images in the paper. |
Then, we kept the DM shape frozen and we switched the light source from the monochromatic to the broadband light. For all the 10 nm and large bandwidths of Table 1, we recorded two images: one coronagraphic image and one off-axis noncoronagraphic image. The former was normalized by the peak intensity of the latter. Recording the images at all filters with a frozen DM shape ensures that the experimental results are not limited by the SCC performance.
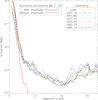 |
Fig. 13 Contrast curves associated with the images obtained in laboratory for the monochromatic light source, the 10 nm bandwidths, and the large bandwidths described in Table 1. Two contrast curves derived from numerical simulations for 133 nm bandwidth are overplotted with no amplitude aberrations (solid red line) and with amplitude aberrations (solid black line). |
For each normalized image, we calculated the azimuthal standard deviation in annuli of width λ0/ 2D centered on the optical axis. The resulting contrast curves plotted in Fig. 13 reach 3 × 10⁻⁷ for all the filters. This is far from the expected performance for the 133 nm bandwidth without amplitude aberrations (full red line and Sect. 3.2). When the amplitude aberrations measured on the THD testbed (Mazoyer et al. 2013) are included, however, the numerical simulations (full black line) are fully consistent with observations. We conclude that the performance obtained in this experiment is limited by amplitude aberrations that cannot be corrected when generating a full dark hole using a single DM.
4.3.2. Correction of phase and amplitude aberrations
In order to probe the performance of the DZPM prototype, we used the SCC and DM to minimize the speckle intensity in half of the DM influence area in monochromatic light (see Fig. 14), hence correcting the effects of both phase and amplitude aberrations. Figure 14 shows the experimental image obtained in monochromatic light (right).
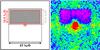 |
Fig. 14 Left: DM influence area (dashed line), dark hole (gray area) and computation area (full red line). Right: laboratory DZPM+SCC image obtained in monochromatic light (637 nm) correcting phase and amplitude aberrations; same spatial scale and same colorbar as Fig. 12. |
The performance close to the optical axis is limited to a ≈ 500 extinction (Sect. 4.1). The exposure time is set to detect the residual speckles inside the dark hole. Thus, the center of the image is saturated. The diffraction pattern of the uncorrected speckles located just outside of the DH spread light inside the DH. In order to not bias the contrast estimations, we compute the 1σ contrast curve in a contrast computation area defined as the area within the DH, removing 1.5 λ0/D on each side (full red line Fig. 14 left). This area covers a range of angular separation from 1.5 to ≈ 17 λ0/D. The 1σ contrast curve associated with the monochromatic image (Fig. 14 right) is plotted as black dashed line in Fig. 15. The contrast is enhanced by a factor of ≈ 40 with respect to the corrections presented in Sect. 4.3.1 (full orange line). We find that the experimental curve is very close to the expected performance obtained in numerical simulations without amplitude aberrations (full red curve) up to 7 λ0/D. Then, there is a plateau at < 2 × 10⁻⁸ between 5 and 17λ0/D, which corresponds to the limitations of the THD testbed (Mazoyer et al. 2013). In conclusion, the prototype reaches the expected performance in monochromatic light.
To study the chromatic behavior of the DZPM coronagraph, we kept the surface shape of the DM frozen and we switched from the laser source to the supercontinuum source using filter-bandwidths from 30 nm to 300 nm. The recorded images are presented in Fig. 16.
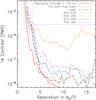 |
Fig. 15 Contrast curves associated with the laboratory images obtained with a laser source, the 30 nm bandwidth, and the very large bandwidths described in Table 1. The experimental performance reached when applying phase-only correction in laser light is overplotted in a cyan dashed curve. The solid red line represents the theoretical limitation derived from numerical simulations with no amplitude aberrations. |
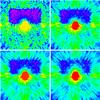 |
Fig. 16 Laboratory DZPM+SCC images in broadbands: Δλ = 30 nm (top left), 200 nm (top right), 250 nm (bottom left), and 300 nm (bottom right); same spatial scale and same colorbar as Fig. 12. |
For a bandwidth of 300 nm, speckles start contaminating the dark hole and they decrease the performance. For Δλ = 200 and 250 nm, the dark hole is not as sharp as for the monochromatic or Δλ = 30 nm case because the speckles are elongated by chromatism. These observations are confirmed when plotting the 1σ contrast curves (Fig. 15).
The monochromatic and Δλ = 30 nm curves are very similar, reaching < 2 × 10⁻⁸ levels between 5 and 17 λ0/D. For Δλ = 200 and 250 nm spectral bandwidths, the performance degrades to ≈ 7 × 10⁻⁸ between 5 and 7 λ0/D and ≈ 4 × 10⁻⁸ between 7 and 17 λ0/D, which is the expected performance (Sect. 3.2.1). Finally, we increased the bandwidth to 300 nm, corresponding to a bandwidth of 50% and found a degradation of the performance by a factor of 3 only, which is coherent with numerical simulations.
All these results demonstrate that the DZPM prototype is chromatically very robust achieving contrast levels better than 7 × 10⁻⁸ for a 250 nm bandwidth.
5. Conclusion
We performed high-contrast imaging experiments associating a dual-zone phase mask coronagraph and a self-coherent camera in laboratory. We are able to achieve 2 × 10⁻⁸ contrast levels between 5 and 17λ0/D in monochromatic light (640 nm) and 4 × 10⁻⁸ for a bandwidth up to 250 nm between 7 and 16λ0/D. Consistent with the numerical simulations, these results conclusively demonstrate both the feasibility of this coronagraph concept and its excellent coronagraphic performance. In particular, we demonstrated the capability of achieving the required contrast level and bandwidth for the THD testbed.
We described the manufacturing and characterization of the two components of the coronagraph, pupil apodizer, and focal plane phase mask, and their insertion into the existing THD testbed. In addition to measuring contrast and bandwidth performance, we also measured the IWA (0.85 λ0/D) and the sensitivity to defocus of our prototype.
The DZPM coronagraph offers several advantages that could be beneficial both for existing instruments and for future generations of ground-based and space-based high-contrast imaging instruments. It is a noninvasive device that can easily be implemented in most existing high-contrast instruments and testbeds; the manufacturing of its components is fully demonstrated and well mastered, and it provides excellent performance for bandwidths up to 40%. We obtained the experimental results presented in this paper with a design optimized for a circular aperture. Theoretical studies and numerical simulations, however, have shown that the DZPM coronagraph can also be optimized for arbitrary telescope apertures (Soummer et al. 2003a; N’Diaye et al. 2010b), which is encouraging in the context of unfriendly pupils.
Finally, this experimental validation paves the way for the development of novel coronagraph designs, such as the recent solutions proposed by N’Diaye et al. (2016), which are based on the dual-zone phase mask or more complex masks (Guyon et al. 2014). These masks are currently manufacturable and should achieve 10-10 raw contrast at small inner working angle with future segmented aperture telescopes.
Acknowledgments
This work was carried out at the Observatoire de Paris (France) and Laboratoire d’Astrophysique de Marseille (LAM) under contract number DA-10083454 with the CNES (Toulouse, France). Moreover, it was partially supported by the National Aeronautics and Space Administration under Grants NNX12AG05G and NNX14AD33G issued through the Astrophysics Research and Analysis (APRA) program. This material is also partially based upon work carried out under subcontract 1496556 with the Jet Propulsion Laboratory funded by NASA and administered by the California Institute of Technology. Finally, we would like to thank L. Pueyo for his support.
References
- Baudoz, P. 1999, Ph.D. thesis, University of Nice [Google Scholar]
- Baudoz, P., Boccaletti, A., Baudrand, J., & Rouan, D. 2006, in IAU Colloq. 200: Direct Imaging of Exoplanets: Science & Techniques, eds. C. Aime, & F. Vakili, 553 [Google Scholar]
- Beuzit, J.-L., Feldt, M., Dohlen, K., et al. 2008, in Ground-based and Airborne Instrumentation for Astronomy II, Proc. SPIE, 7014, 701418 [CrossRef] [Google Scholar]
- Carbillet, M., Bendjoya, P., Abe, L., et al. 2011, Exp. Astron., 30, 39 [NASA ADS] [CrossRef] [Google Scholar]
- Dalcanton, J., Seager, S., Aigrain, S., et al. 2015, ArXiv e-prints [arXiv:1507.04779] [Google Scholar]
- Delorme, J. R., Galicher, R., Baudoz, P., et al. 2016, A&A, 588, A136 [NASA ADS] [CrossRef] [EDP Sciences] [Google Scholar]
- Dohlen, K., Langlois, M., Lanzoni, P., et al. 2006, in Proc. SPIE, 6267, 626734 [Google Scholar]
- Dorrer, C., & Zuegel, J. D. 2007, J. Opt. Soc. Am. B, 24, 1268 [NASA ADS] [CrossRef] [Google Scholar]
- Galicher, R., Baudoz, P., & Rousset, G. 2008, A&A, 488, L9 [NASA ADS] [CrossRef] [EDP Sciences] [Google Scholar]
- Galicher, R., Baudoz, P., Rousset, G., Totems, J., & Mas, M. 2010, A&A, 509, A31 [NASA ADS] [CrossRef] [EDP Sciences] [Google Scholar]
- Galicher, R., Baudoz, P., & Baudrand, J. 2011, A&A, 530, A43 [NASA ADS] [CrossRef] [EDP Sciences] [Google Scholar]
- Galicher, R., Baudoz, P., Delorme, J. R., et al. 2014, in Space Telescopes and Instrumentation 2014: Optical, Infrared, and Millimeter Wave, Proc. SPIE, 9143, 91435A [NASA ADS] [CrossRef] [Google Scholar]
- Guerri, G., Daban, J.-B., Robbe-Dubois, S., et al. 2011, Exp. Astron., 30, 59 [NASA ADS] [CrossRef] [Google Scholar]
- Guyon, O., & Roddier, F. J. 2000, in Interferometry in Optical Astronomy, eds. P. Léna, & A. Quirrenbach, Proc. SPIE, 4006, 377 [Google Scholar]
- Guyon, O., Roddier, C., Graves, J. E., et al. 1999, PASP, 111, 1321 [NASA ADS] [CrossRef] [Google Scholar]
- Guyon, O., Pluzhnik, E. A., Galicher, R., et al. 2005, ApJ, 622, 744 [NASA ADS] [CrossRef] [Google Scholar]
- Guyon, O., Hinz, P. M., Cady, E., Belikov, R., & Martinache, F. 2014, ApJ, 780, 171 [Google Scholar]
- Hinkley, S., Oppenheimer, B. R., Zimmerman, N., et al. 2011, PASP, 123, 74 [NASA ADS] [CrossRef] [Google Scholar]
- Jovanovic, N., Guyon, O., Martinache, F., et al. 2014, in Ground-based and Airborne Instrumentation for Astronomy V, Proc. SPIE, 9147, 91471 [Google Scholar]
- Macintosh, B. A., Graham, J. R., Palmer, D. W., et al. 2008, in Adaptive Optics Systems, Proc. SPIE, 7015, 701518 [CrossRef] [Google Scholar]
- Martinez, P., Dorrer, C., Aller-Carpentier, E., et al. 2009, The Messenger, 137, 18 [NASA ADS] [Google Scholar]
- Mas, M., Baudoz, P., Rousset, G., Galicher, R., & Baudrand, J. 2010, in Ground-based and Airborne Instrumentation for Astronomy III, Proc. SPIE, 7735, 773566 [CrossRef] [Google Scholar]
- Mawet, D., Riaud, P., Absil, O., & Surdej, J. 2005, ApJ, 633, 1191 [NASA ADS] [CrossRef] [Google Scholar]
- Mazoyer, J., Baudoz, P., Galicher, R., Mas, M., & Rousset, G. 2013, A&A, 557, A9 [NASA ADS] [CrossRef] [EDP Sciences] [Google Scholar]
- N’Diaye, M., Dohlen, K., Cuevas, S., et al. 2010a, A&A, 509, A8 [NASA ADS] [CrossRef] [EDP Sciences] [Google Scholar]
- N’Diaye, M., Dohlen, K., Cuevas, S., Soummer, R., & Sánchez, C. 2010b, in Modern Technologies in Space- and Ground-based Telescopes and Instrumentation, Proc. SPIE, 7739, 77391 [CrossRef] [Google Scholar]
- N’Diaye, M., Dohlen, K., Tisserand, S., et al. 2011, in Optical Fabrication, Testing, and Metrology IV, Proc. SPIE, 8169, 81690 [Google Scholar]
- N’Diaye, M., Dohlen, K., Cuevas, S., et al. 2012a, A&A, 538, A55 [NASA ADS] [CrossRef] [EDP Sciences] [Google Scholar]
- N’Diaye, M., Dohlen, K., Fusco, T., et al. 2012b, in Modern Technologies in Space- and Ground-based Telescopes and Instrumentation II, Proc. SPIE, 8450, 84500 [CrossRef] [Google Scholar]
- N’Diaye, M., Dohlen, K., Caillat, A., et al. 2014, in Adaptive Optics Systems IV, Proc. SPIE, 9148, 91485 [Google Scholar]
- N’Diaye, M., Soummer, R., Pueyo, L., et al. 2016, ApJ, 818, 163 [NASA ADS] [CrossRef] [Google Scholar]
- Seager, S., & Deming, D. 2010, ARA&A, 48, 631 [NASA ADS] [CrossRef] [Google Scholar]
- Sivaramakrishnan, A., Soummer, R., Carr, G. L., et al. 2009, in Techniques and Instrumentation for Detection of Exoplanets IV, Proc. SPIE, 7440, 74401 [CrossRef] [Google Scholar]
- Sivaramakrishnan, A., Soummer, R., Oppenheimer, B. R., et al. 2010, in Ground-based and Airborne Instrumentation for Astronomy III, Proc. SPIE, 7735, 773586 [CrossRef] [Google Scholar]
- Soummer, R. 2005, ApJ, 618, L161 [NASA ADS] [CrossRef] [Google Scholar]
- Soummer, R., Aime, C., & Falloon, P. E. 2003a, A&A, 397, 1161 [NASA ADS] [CrossRef] [EDP Sciences] [Google Scholar]
- Soummer, R., Dohlen, K., & Aime, C. 2003b, A&A, 403, 369 [NASA ADS] [CrossRef] [EDP Sciences] [Google Scholar]
- Spergel, D., Gehrels, N., Baltay, C., et al. 2015, ArXiv e-prints [arXiv:1503.03757] [Google Scholar]
- Trauger, J., Moody, D., Gordon, B., Krist, J., & Mawet, D. 2011, in Techniques and Instrumentation for Detection of Exoplanets V, Proc. SPIE, 8151, 81510 [Google Scholar]
- Vigan, A., N’Diaye, M., Dohlen, K., et al. 2016, A&A, 586, A144 [NASA ADS] [CrossRef] [EDP Sciences] [Google Scholar]
All Tables
Dimensions of the central parts of the phase mask specified (specifications) and measured using a Wyko interferential microscope (measured dimensions).
All Figures
|
Fig. 1 Scheme of the coronagraphic layout. |
| In the text | |
|
Fig. 2 Substract layout and mask profile. |
| In the text | |
|
Fig. 3 Optical layout of the THD testbed. |
| In the text | |
|
Fig. 4 Amplitude profile of the designed apodizer with ω1 = −0.584907 and ω2 = 0.128201. |
| In the text | |
|
Fig. 5 Picture of the apodizer (left) and phase mask in its assembly (right). |
| In the text | |
|
Fig. 6 Apodizer amplitude map: specification (left) and laser measurement (right). |
| In the text | |
|
Fig. 7 Apodizer amplitude profile: relative difference between laser measurement and specified function (Fig. 4). |
| In the text | |
|
Fig. 8 Apodizer amplitude profile: relative error between the laser and the other filters. |
| In the text | |
|
Fig. 9 Profile of the phase mask measured by profilometry. Top: general profile. Middle: horizontal zoom at the mask transitions. Bottom: vertical zoom on the roughness of the different mask steps. |
| In the text | |
|
Fig. 10 Intensity transmission of the DZPM as function of tips (black diamonds) and tilts (green crosses) in monochromatic light (637 nm). The red curve is the function derived from numerical simulations. |
| In the text | |
|
Fig. 11 Azimuthally averaged intensity of the DZPM coronagraphic images at different angular separations from the star as a function of a defocus term in the entrance pupil. Simulated and experimental intensities obtained in monochromatic light (637 nm) are shown as lines and points, respectively. Intensities are averaged over an annulus of 1 λ0/D width centered at a given separation. |
| In the text | |
|
Fig. 12 Left: DM influence area (dashed line) and dark hole (gray area). Right: laboratory DZPM+SCC image obtained in monochromatic light (637 nm) only correcting phase aberrations. Field of view: 40 λ0/D by 40 λ0/D. The colorbar associated with this image is the same for all the coronagraphic images in the paper. |
| In the text | |
|
Fig. 13 Contrast curves associated with the images obtained in laboratory for the monochromatic light source, the 10 nm bandwidths, and the large bandwidths described in Table 1. Two contrast curves derived from numerical simulations for 133 nm bandwidth are overplotted with no amplitude aberrations (solid red line) and with amplitude aberrations (solid black line). |
| In the text | |
|
Fig. 14 Left: DM influence area (dashed line), dark hole (gray area) and computation area (full red line). Right: laboratory DZPM+SCC image obtained in monochromatic light (637 nm) correcting phase and amplitude aberrations; same spatial scale and same colorbar as Fig. 12. |
| In the text | |
|
Fig. 15 Contrast curves associated with the laboratory images obtained with a laser source, the 30 nm bandwidth, and the very large bandwidths described in Table 1. The experimental performance reached when applying phase-only correction in laser light is overplotted in a cyan dashed curve. The solid red line represents the theoretical limitation derived from numerical simulations with no amplitude aberrations. |
| In the text | |
|
Fig. 16 Laboratory DZPM+SCC images in broadbands: Δλ = 30 nm (top left), 200 nm (top right), 250 nm (bottom left), and 300 nm (bottom right); same spatial scale and same colorbar as Fig. 12. |
| In the text | |
Current usage metrics show cumulative count of Article Views (full-text article views including HTML views, PDF and ePub downloads, according to the available data) and Abstracts Views on Vision4Press platform.
Data correspond to usage on the plateform after 2015. The current usage metrics is available 48-96 hours after online publication and is updated daily on week days.
Initial download of the metrics may take a while.