Free Access
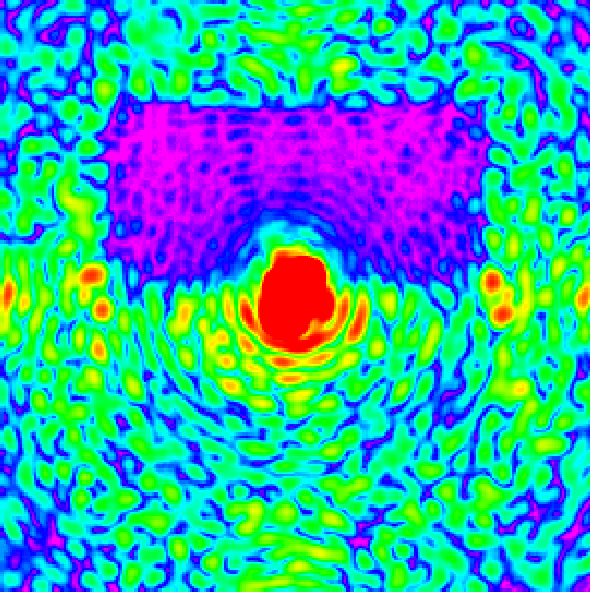
Fig. 14
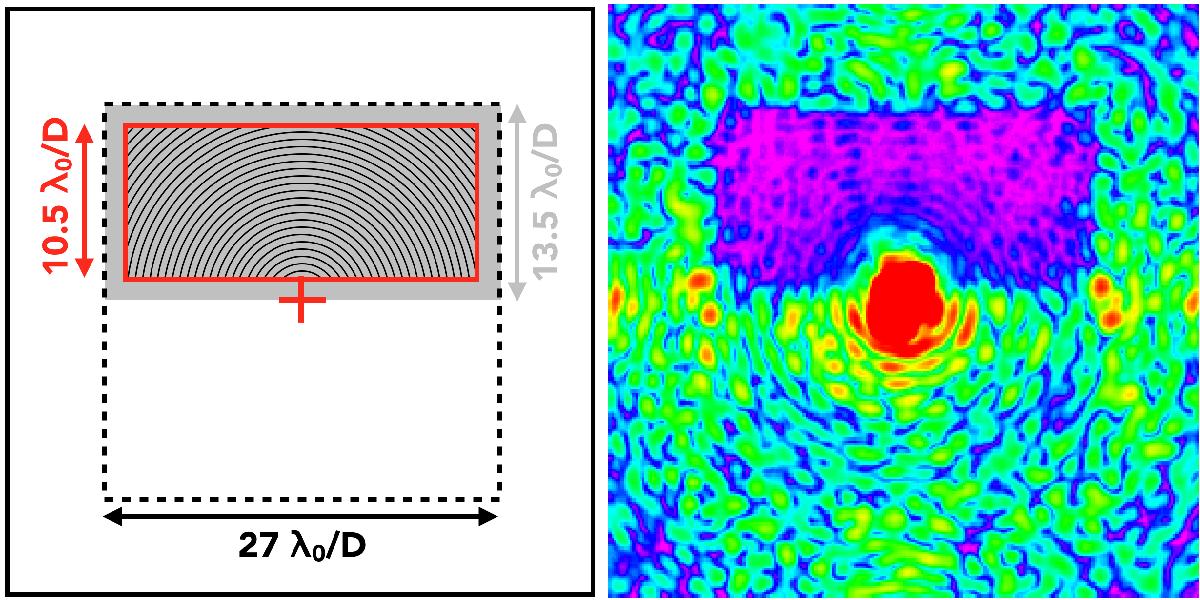
Left: DM influence area (dashed line), dark hole (gray area) and computation area (full red line). Right: laboratory DZPM+SCC image obtained in monochromatic light (637 nm) correcting phase and amplitude aberrations; same spatial scale and same colorbar as Fig. 12.
This figure is made of several images, please see below:
Current usage metrics show cumulative count of Article Views (full-text article views including HTML views, PDF and ePub downloads, according to the available data) and Abstracts Views on Vision4Press platform.
Data correspond to usage on the plateform after 2015. The current usage metrics is available 48-96 hours after online publication and is updated daily on week days.
Initial download of the metrics may take a while.