| Issue |
A&A
Volume 592, August 2016
|
|
|---|---|---|
| Article Number | A45 | |
| Number of page(s) | 7 | |
| Section | Interstellar and circumstellar matter | |
| DOI | https://doi.org/10.1051/0004-6361/201628192 | |
| Published online | 19 July 2016 | |
N2H+ and N15NH+ toward the prestellar core 16293E in L1689N
1 Université Grenoble Alpes, IPAG, 38000 Grenoble, France
e-mail: fabien.daniel@obs.ujf-grenoble.fr
2 CNRS, IPAG, 38000 Grenoble, France
3 LERMA, Observatoire de Paris, PSL Research University, CNRS, Sorbonne Universités, UPMC Université Paris 06, 75014 Paris, France
4 LOMC-UMR 6294, CNRS-Université du Havre, 25 rue Philippe Lebon, BP 1123, 76063 Le Havre Cedex, France
5 LERMA, Observatoire de Paris, PSL Research University, CNRS, Sorbonne Universités, UPMC Université Paris 06, École Normale Supérieure, 75005 Paris, France
6 California Institute of Technology, Cahill Center for Astronomy and Astrophysics 301-17, Pasadena, CA 91125, USA
7 LERMA, Observatoire de Paris, PSL Research University, CNRS, Sorbonne Universités, UPMC Université Paris 06, 92190 Meudon, France
Received: 26 January 2016
Accepted: 28 March 2016
Context. Understanding the processes that could lead to an enrichment of molecules in 15N atoms is of particular interest because this may shed light on the relatively strong variations observed in the 14N/15N ratio in various solar system environments.
Aims. The sample of molecular clouds where 14N/15N ratios have been measured currently is small and has to be enlarged to allow statistically significant studies. In particular, the N2H+ molecule currently shows the broadest spread of 14N/15N ratios in high-mass star-forming regions. However, the 14N/15N ratio in N2H+ was obtained in only two low-mass star-forming regions (L1544 and B1b). We here extend this sample to a third dark cloud.
Methods. We targeted the 16293E prestellar core, where the N15NH+J = 1−0 line was detected. Using a model previously developed for the physical structure of the source, we solved the molecular excitation with a nonlocal radiative transfer code. For this purpose, we computed specific collisional rate coefficients for the N15NH+-H2 collisional system. As a first step of the analysis, the N2H+ abundance profile was constrained by reproducing the N2H+J = 1−0 and 3−2 maps. A scaling factor was then applied to this profile to match the N15NH+J = 1−0 spectrum.
Results. We derive a column density ratio N2H+/N15NH+ = 330+170-100.
Conclusions. We performed a detailed analysis of the excitation of N2H+ and N15NH+ in the direction of the 16293E core with modern models that solve the radiative transfer and with the most accurate collisional rate coefficients available to date. We obtained the third estimate of the N2H+/N15NH+ column density ratio in the direction of a cold prestellar core. The current estimate ~330 agrees with the typical value of the elemental isotopic ratio in the local interstellar medium. It is lower than in some other cores, however, where values as high as 1300 have been reported.
Key words: astrochemistry / ISM: abundances / ISM: molecules / radiative transfer
© ESO, 2016
1. Introduction
Molecular isotopic ratios are invaluable tools for studying the origin of solar system materials and the possible link of these materials with interstellar chemistry. The second-largest isotopic variations in the solar system after those of hydrogen are observed for nitrogen. The 14N/15N ratio varies by a factor of ~9 from the protosolar nebula (PSN) value of ~440 to the hotspots in meteorites, where ratios as low as ~50 have been reported (see Füri & Marty 2015, and references therein). Enrichment in 15N with respect to the PSN value is observed in most objects of the solar system, except for Jupiter. The reference value for cosmochemists is that of Earth with a 14N/15N ratio of 272 (measured in atmospheric N2). In comets, the 14N/15N ratio has been measured in the three species: CN, HCN, and NH2, and the measurements were shown to cluster near 14N/15N ~ 150 (see Rousselot et al. 2014, and references therein).
Several hypotheses have been proposed to explain 14N/15N enrichments in the solar system. These enrichments fall into two main categories. The first category concerns specific isotopic effects associated with the N2 photodissociation by UV light from the proto-Sun or from nearby stars, such as self-shielding (e.g., Lyons et al. 2009). In the second category, 15N enrichment is caused by chemical fractionation through ion-molecule reactions in the cold and dense interstellar medium (ISM) or in the cold regions of the protosolar disk.
In the dense ISM, direct observation of the nitrogen reservoir (presumably N or N2) is not possible, and the 14N/15N ratio has been obtained so far from the trace species N2H+, NH3, NH2D, CN, HCN, and HNC. In the local ISM, 15N enrichments (14N/15N < 300) have been measured in CN, HCN, and HNC (Ikeda et al. 2002; Adande & Ziurys 2012; Hily-Blant et al. 2013a; Wampfler et al. 2014), but not in the ammonia isotopologs for which the 14N/15N ratio is close to the PSN value or higher (Gerin et al. 2009; Lis et al. 2010; Daniel et al. 2013). The case of N2H+ is the most intriguing, with values ranging from ~180 to ~1300 (Bizzocchi et al. 2013; Daniel et al. 2013; Fontani et al. 2015). The observational situation has thus significantly improved in the past five years, since a number of new 14N/15N estimates have been made available. The results, however, are still puzzling. The wide spread in molecular 14N/15N ratios reflects, at least partly, that the measurements are difficult as a result of opacity and excitation effects, or the use of the double-isotope method. In addition, a gradient of 14N/15N with the galactocentric distance has been measured in CN and HNC by Adande & Ziurys (2012), as predicted by galactic chemical evolution models. The unambiguous observation of 15N chemical fractionation in the ISM thus remains a challenging task. We also note that the 14N/15N ratio has recently been determined for the first time in a protoplanetary disk (Guzmán et al. 2015). A ratio of 200 ± 100 was inferred from HCN, which is compatible with the measurements previously reported in dark clouds and comets.
Turning to theory, the pioneering model of Terzieva & Herbst (2000) predicted that chemical fractionation in 15N should only be modest (~25%) and hardly detectable in the ISM. Subsequently, a fractionation mechanism based on CO depletion was suggested, predicting that two different pathways can drive the 15N-fractionation: a slow way to ammonia and a rapid way to HCN and other nitriles (Charnley & Rodgers 2002; Rodgers & Charnley 2004, 2008). A chemical origin of the differential 15N enrichment between hydrides and nitriles was also proposed by Hily-Blant et al. (2013a,b). In addition, by considering nuclear-spin effects in ion molecule reactions involving the ortho and para forms of H2, Wirström et al. (2012) have shown that the 15N enrichments of nitriles do not correlate with deuterium (D) enrichments, as observed in meteorites. On the other hand, a recent reinvestigation of gas-phase chemical processes including D, 13C, and 15N species has suggested that the main 15N-fractionation routes are in fact inefficient (Roueff et al. 2015). Hence, although theory has improved, no model is currently able to reproduce the whole set of observational data. It is generally believed that important routes of nitrogen fractionation are still missing in the models (see, e.g., Fontani et al. 2015).
The dyazenilium ion (N2H+) is an interesting target for several reasons. First, it is chemically a direct daughter product of N2, one of the two main nitrogen reservoirs with atomic nitrogen, through the proton transfer reaction N2+H N2H++H2. Second, the 14N/15N ratio in N2H+ can be determined without recourse to the double-isotope method, which is commonly used for carbon-bearing species (see, e.g., Adande & Ziurys 2012; Hily-Blant et al. 2013a,b). Third, accurate collisional rate coefficients for N2H++H2 have recently been made available (see Lique et al. 2015, and below). Finally, observations of N2H+ show the strongest variations in the 14N/15N ratio of all the nitrogen carriers. In the prestellar core L1544, this ratio was estimated to be ~1000 ± 200 (Bizzocchi et al. 2013), with N15NH+ and 15NNH+ having nearly equal abundances. In the B1b molecular cloud, the 14N/15N ratio was estimated to be
  in N15NH+ (Daniel et al. 2013). The low signal-to-noise ratio achieved for the observations of the 15NNH+ isotopolog led to a lower limit of 600 for this isotopolog. Finally, in high-mass star-forming cores, the 14N/15N ratio was estimated to be in the range 180–1300 (Fontani et al. 2015).
We here provide a new measurement of the 14N/15N ratio derived from observations of two isotopologs of dyazenilium, N2H+ and N15NH+, in the direction of the low-mass prestellar core 16293E in L1689N. We note that in contrast to the L1544 prestellar core, this source is not isolated and is influenced by the close-by Class 0 protostar IRAS 16293-2422. In the direction of this region, previous observations of some of the N2H+ isotopologs were reported by Castets et al. (2001) for N2H+ and by Gerin et al. (2001) for N2D+. In Sect. 2 we report details on the observations used in this study. Section 3 describes the calculations performed for the N15NH+-H2 rate coefficients. Section 4 deals with the molecular excitation calculations, and our conclusions are given in Sect. 5.
2. Observations
We used the N2H+J = 1−0 SEST 15 m telescope observations reported in Castets et al. (2001). We discovered, however, that these data suffered from observational artifacts. This was detected by comparing the observed spectra with spectra of the same line that were observed more recently at the IRAM 30 m Telescope. This problem is described in more detail below.
IRAM 30 m observations of N2H+ were performed in early 2015 (17 February and 2 April). The weather in February was bad, cloudy and unstable, but it was excellent in April (1−2 mm precipitable water vapor). Saturn, only a few degrees away from the source, was used for pointing and focusing the telescope during both runs. Pointing was good with an uncertainty below 3″. Observations were made with the EMIR0 receivers in frequency-switch mode with both the autocorrelator (VESPA) at 9.8 kHz (=31.4 m s-1) sampling and the fast Fourier transform spectrometer (FFTS) at 48.8 kHz (=157 m s-1) sampling. The rest frequency of the line for the main hyperfine component is 93173.764 MHz, following Pagani et al. (2009). Tsys was typically 100 K ( scale), with the source elevation ranging from 18.5° to 28.5°. Each integration lasted one minute, and both polarizations were averaged and then folded. The typical noise is 70 mK (after subtracting a second- or third-order baseline). The FWHM beam size is 26.5″ and the sampling was made every 15″. The main beam efficiency (0.80) was interpolated from an IRAM table (0.81 at 86 GHz and 0.78 at 115 GHz). These data will be presented and analyzed in detail in a forthcoming paper (Pagani et al., in prep.) along with other observations.
By convolving the IRAM data to the SEST resolution, we found a relatively good correspondence in peak intensity, but not in the line profile. This means that the integrated intensity of the SEST data (16.4 ± 0.04 K km s-1) is somewhat higher than the intensity from IRAM (14.1 ± 0.003 K km s-1), to be precise, +16%. The discrepancy is much higher than the systematic uncertainties. The SEST data (Castets et al. 2001) were obtained with an acousto-optical spectrometer that caused an undue widening of the lines and line shape change that cannot be reproduced by simply smoothing the IRAM data. To use the SEST data, we therefore multiplied them by 0.86 and introduced an ad hoc convolution in frequency, as described in the next section.
Single-dish observations of the 1 mm molecular transitions presented here were carried out in 2013 May–June using the 10.4 m Leighton Telescope of the Caltech Submillimeter Observatory (CSO) on Mauna Kea, Hawaii. We used the wideband 230 GHz facility SIS receiver and the FFTS backend that covers the full 4 GHz intermediate frequency (IF) range with a 270 kHz channel spacing (0.37 km s-1 at 220 GHz). Pointing of the telescope was checked by performing five-point continuum scans of planets and strong dust continuum sources. The CSO main-beam efficiency at 230 GHz at the time of the observations was determined from total-power observations of planets to be ~65%. The absolute calibration uncertainty is ~15% and the FWHM CSO beam size is ~35″ at 220 GHz.
The N15NH+J = 1−0 observations were performed in August 2014 with the IRAM 30 m Telescope during average weather conditions (2−4 mm of precipitable water vapor). The Eight Mixer Receiver (EMIR) was tuned to 92.0 GHz. We used the FFTS backend with 49.8 kHz (~160 m s-1) spectral resolution, leading to an instantaneous bandpass of 1.8 GHz and a velocity resolution of 0.16 km s-1. The J = 1−0 transition of 15NNH+, around 90.25 GHz, was not covered with the chosen setup, which aimed at detecting other species. The system temperature was about 140 K and the source elevation varied between 18° and 28°. The observations were performed in position switching, with the reference position set 300″ west of the source. The nearby planets Mars and Saturn were used to check the telescope pointing and the focus. The data were reduced with CLASS, and the noise level is 19 mK after linear base lines were removed.
3. N2H+ and N15NH+ collisional rate coefficients
Collisional rate coefficients for the N2H+-H2(J = 0)1 system have been published recently by Lique et al. (2015). We calculated hyperfine-structure-resolved excitation rate coefficients that are based on a new potential energy surface (PES) obtained from highly correlated ab initio calculations (Spielfiedel et al. 2015) for temperatures ranging from 5 K to 70 K. The new rate coefficients are significantly higher than the N2H+-He rate coefficients previously published (Daniel et al. 2005). In addition, the differences cannot be reproduced by a simple scaling relationship.
As a first approximation, these new rate coefficients could be used to analyze N15NH+ emission spectra since both N2H+ and N15NH+ share the same molecular properties (when the hyperfine splitting induced by the internal nitrogen is neglected). Recent studies have shown, however, that isotopic effects in inelastic collisions can be important (Scribano et al. 2010; Dumouchel et al. 2012), even in the case of 14N→15N substitution (Flower & Lique 2015). We therefore decided to compute specific N15NH+-H2(J = 0) rate coefficients.
Within the Born-Oppenheimer approximation, the full electronic ground-state potential is identical for the N2H+-H2 and N15NH+-H2 systems and depends only on the mutual distances of the five atoms involved. We therefore used the N2H+-H2 PES of Spielfiedel et al. (2015) and the adiabatic-hindered-rotor treatment for the scattering calculations. This treatment allows para-H2(J = 0) to be treated as if it were spherical. Zero-point vibrational effects are different in N2H+ and N15NH+, but these effects are expected to be moderate and were therefore neglected in the present calculations. The only difference between the N2H+-H2 and N15NH+-H2 PES is thus the position of the center of mass taken for the origin of the Jacobi coordinates; this effect was taken into account in our calculations.
Since the 14N and 15N nitrogen atoms possess a non-zero nuclear spin (I = 1 and I = 1 / 2, respectively), the N2H+ and N15NH+ rotational energy levels are split into hyperfine levels. In the astronomical observations, however, the hyperfine structure that is due to 15N is not resolved. The hyperfine levels of the N15NH+ molecules are therefore characterized by the two quantum numbers J and F. Here, F results from the coupling of J with I (I being the nuclear spin of the external 14N atom).
The hyperfine splitting in the N2H+ isotopologs is very small. Assuming that the hyperfine levels are degenerate, it is possible to simplify the hyperfine scattering problem using recoupling techniques as described in Daniel et al. (2004, 2005) and in Faure & Lique (2012). We therefore performed close-coupling calculations (Arthurs & Dalgarno 1960) for the pure rotational excitation cross-sections using the MOLSCAT program (Hutson & Green 1994), as in Lique et al. (2015) for the main isotopolog. The N15NH+ rotational energy levels were computed using the rotational constants of Dore et al. (2009). Calculations were carried out for total energies of up to 500 cm-1. Parameters of the integrator were tested and adjusted to ensure a typical precision to within 0.05 Å2 for the inelastic cross-sections. At each energy, channels with J up to 28 were included in the rotational basis to converge the calculations for all the transitions between N15NH+ levels up to J = 7. Using the recoupling technique and the stored S-matrix elements, the hyperfine-state-resolved cross-sections were obtained for all hyperfine levels up to J = 7.
From the calculated cross-sections, the corresponding thermal rate coefficients at temperature T can be obtained by an average over the collision energy (Ec),  (1)where σα → β is the cross–section from initial level α to final level β, μ is the reduced mass of the system, and kB is Boltzmann’s constant. Using the computational scheme described above, we obtained N15NH+-H2(J = 0) rate coefficients for temperatures of up to 70 K. These coefficients are expected to be as accurate as those computed for the main isotopolog by Lique et al. (2015). This means that the main source of uncertainty is the use of the adiabatically hindered rotor approximation, which was shown to introduce errors lower than 5−10% (Lique et al. 2015; Spielfiedel et al. 2015). A typical accuracy of 10% is thus expected for the rate coefficients of the N2H+ isotopologs. The complete set of (de-)excitation rate coefficients with J,J′ ≤ 7 will be made available through the LAMDA (Schöier et al. 2005) and BASECOL (Dubernet et al. 2013) databases.
Figure 1 presents the temperature variation of the N2H+-H2(J = 0) and N15NH+-H2(J = 0) rate coefficients for a few hyperfine transitions associated with the J = 3 → 2 and 2→1 rotational transitions. To enable a direct comparison, we summed the N2H+-H2(J = 0) rate coefficients over the hyperfine structure associated with the internal nitrogen nucleus.
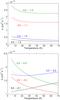 |
Fig. 1 Temperature variation of the hyperfine resolved N2H+–H2(j = 0) (solid lines) and N15NH+–H2(j = 0) (dotted lines) rate coefficients for j = 2,F → j′ = 1,F′ and j = 3,F → j′ = 2,F′ transitions. |
The differences between the N2H+ and N15NH+ rate coefficients are clearly moderate. The two sets of data differ by less than 20 percent over the whole temperature range. We find, however, that the strongest deviations occur at temperatures typical of cold molecular clouds (T = 5−20 K), and we observe that the N2H+ over N15NH+ rate coefficients ratios tend to increase with decreasing temperature. The differences are due to both the center-of-mass shift in the interaction potential and the use of a specific description of the isotopolog energy levels. In conclusion, we found that the isotopolog-specific results differed from each other to an extent that they may be significant for analyses of observations of the hyperfine transitions of these species, at least for cold dark cloud conditions. Modeling N15NH+ with N2H+ rate coefficients will typically induce errors in the N15NH+ column density estimate on the same order of magnitude as the differences found in rate coefficients. Hence, we can expect that earlier studies that resorted to the same set of rates for both isotopologs do not suffer from errors higher than 20%. In particular, we expect this conclusion to remain true when He is the collisional partner (Daniel et al. 2005).
4. Radiative transfer modeling
To obtain an accurate estimate of the 14N/15N ratio in N2H+, we obtained the column densities of the two isotopologs by solving the molecular excitation problem. The method we used is similar to the approach described in Daniel et al. (2013), where the 14N/15N ratio was estimated for various molecules in the direction of B1b. We here analyzed the prestellar core of 16293E. To perform the analysis, we used the physical structure of 16293E described in Bacmann et al. (2016). In this study, variations of the H2 density and of the dust and gas temperature throughout the core were derived using continuum observations at wavelengths ranging from 160 μm to 1.3 mm. The core center was then fixed at an intermediate distance between the maxima of the 850 μm and 1.3 mm maps. More precisely, its coordinates were fixed at α = 16h32m28.8s, δ = −24°29′4″ (J2000). The offsets indicated in the figures are given according to this reference position throughout.
The N2H+ spectroscopy was taken from Caselli et al. (1995) and Pagani et al. (2009). For the main N2H+ isotopolog, the N2H+-H2 rate coefficients were taken from Lique et al. (2015). For the rare N15NH+ isotopolog, the rate coefficients were described in the previous section and the spectroscopy was taken from Dore et al. (2009). Finally, the molecular excitation and radiative transfer were solved with the 1Dart code described in Daniel & Cernicharo (2008), which takes the line overlap between hyperfine lines into account.
As a first step of our analysis, we constrained the abundance of the main N2H+ isotopolog throughout the core. To this purpose, we made use of the J = 1−0 and J = 3−2 maps that were obtained at the SEST and CSO telescopes, respectively. Additionally, we used a spectrum of the J = 1−0 line, observed at the IRAM 30 m Telescope toward a position offset by ~17′′ from the core center. The comparison between the IRAM and SEST observations made by degrading the IRAM data to the SEST resolution show that the spectra obtained at the SEST telescope have broader line widths (see Sect. 2). To explain these differences, we assumed that the SEST observations suffered from systematic uncertainties and therefore only took the relative variations of the spectra from one map position to another into account. To reproduce the observational artifact linked to the SEST observations, we additionally performed a spectral convolution of the synthetic spectra, with a spectral response given by a Gaussian. The associated width was adjusted so that a model that would fit the IRAM 30 m J = 1−0 spectra would give an equally good fit for the closest SEST observation. The corresponding point of the SEST map is 8.7″ from the core center and the IRAM 30 m and SEST J = 1−0 observations are separated by ~10″ from each other. The result of this procedure corresponds to the observations plotted in the bottom and middle panels of Fig. 2.
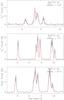 |
Fig. 2 Comparison between model and observations for the SEST (bottom panel) and IRAM (middle panel) N2H+J = 1−0 line. The top panel shows the CSO N2H+J = 3−2 line. In each panel, we show the offset between the position observed and the core center. For each spectrum, the gray area indicates the variation of intensity obtained by varying the N2H+ abundance as indicated in Fig. 5. |
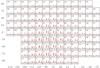 |
Fig. 3 Comparison between model and observations for the N2H+(J = 1−0) map observed at SEST. In each panel, the distance to the core center is indicated in arcseconds at the upper left side of the box. The reference coordinates of the map are α = 16h32m22.76s, δ = –24°28′33.1″ (J2000), as given in Castets et al. (2001), which corresponds to a position close to the 16293-2422 protostar. This protostar is located ~90′′ northwest of the 16293E core center. |
As previously said, the modeling is performed using the physical structure (i.e., H2 density, gas and dust temperatures, etc.) described in Bacmann et al. (2016). We recall that the density is constant at ~1.4 × 107 cm-3 within a radius of 4′′ and then decreases outward. The temperature at the core center is 11 K and increases outward up to 16 K. The only free parameters of the current modeling are therefore linked to the N2H+ abundance profile. To fit the observations, we introduced radial zones within which the N2H+ abundance was kept constant. We started with the simplest model, that is, with a constant abundance throughout the cloud (i.e., one free parameter). We then increased the number of radial zones, that is, the number of free parameters, until we obtained a reasonable fit to the observations, the quality of the fit being gauged by eye. Doing so, a satisfactory fit was obtained with only three radial regions. The fit of the J = 1−0 and 3−2 lines obtained at positions close to the core center are shown in Fig. 2 and the SEST and CSO maps are shown in Figs. 3 and 4. These figures show some discrepancies between the model and observations at some particular positions. We estimate, however, that the overall agreement is satisfactory given the non–sphericity of the 16293E core (see the molecular emission maps in, e.g., Castets et al. 2001; Lis et al. 2002). The N2H+ abundance that corresponds to these observations is reported in Fig. 5. In each region of the abundance profile, we determined error bars by varying the N2H+ abundance so that the resulting spectra did not depart significantly from the best model. The corresponding variations from our best estimate correspond to the gray zones in Fig. 2. The column density inferred from this model in the direction of the center of the sphere is N(N2H+) =  cm-2.
cm-2.
To model the spectrum of the N15NH+J = 1−0 line observed at ~15” from the core center, we assumed that the abundance profile is similar to that of the main isotopolog. The observed spectrum was then reproduced by introducing an overall scaling factor to the abundance. The observations are correctly reproduced with an abundance ratio N2H+/N15NH+~ , and the comparison between the model and observations is shown in Fig. 6. In this figure, the gray area corresponds to the error bars of the ratio.
As in Daniel et al. (2013), we calculated a mean excitation temperature  from the source model. For the N2H+ and N15NH+J = 1−0 lines, we derived values of
  K and
K and  K, respectively, where the sub– and superscripts indicate the spread of values throughout all the hyperfine components. The broader spread of values for the main isotopolog is a consequence of higher line opacities, which is accompanied by a departure from a single excitation temperature (Daniel et al. 2006). The opacities summed over all the components are ~17.3 and 0.06 for the N2H+ and N15NH+ isotopologs, respectively. We note that despite the higher opacity of the N2H+J = 1−0 line, is not enhanced by line trapping effects for this isotopolog. In the current case, the increase in Tex that is due to line trapping is counterbalanced by the increase of the N15NH+-H2 rate coefficients. In the model of B1b, Daniel et al. (2013) found that the of N2H+ was enhanced by ~17% with respect to the N15NH+, the two calculations being performed with the same set of rate coefficients. In the current case, the assumption of a similar Tex to describe the two isotopologs would therefore apply.
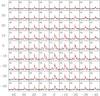 |
Fig. 4 Comparison between model and observations for the N2H+(J = 3−2) map observed at CSO. In each panel, the distance to the core center is indicated in arcseconds in the upper left side of the box. The reference coordinates of the map are α = 16h32m28.83s, δ = –24°28′56.9″ (J2000), which is located ~7′′ away from the position we assume for the core center. |
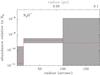 |
Fig. 5 N2H+ abundance profile. |
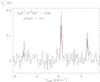 |
Fig. 6 Comparison between model and observations for the N15NH+J = 1−0 line. |
5. Discussion
As explained in the Introduction, the strong variations of the 14N/15N ratio in the solar system are not understood. We recall that this ratio is ~440 in the solar wind, ~270 on Earth, and ~150 in comets. We refer to Füri & Marty (2015) for a recent review of the literature. The main question is whether the 15N enrichments indicate interstellar inheritance or nitrogen fractionation in the protoplanetary disk phase, or both. Guzmán et al. (2015) recently showed that the average 14N/15N ratio in HCN in the direction of the MWC 480 disk is 200 ± 100. This value is similar to the ratios observed in comets and dark clouds, but the signal-to-noise ratios of these data were not high enough to allow a prestellar or protoplanetary disk origin to be distinguished (see the discussion in Guzmán et al. 2015). In addition, as explained above, 15N enrichments derived in HCN are ambiguous because 13C might be depleted (Roueff et al. 2015).
We here provided a new measurement of the 14N/15N ratio in a prestellar core by observing N2H+ and N15NH+. The derived abundance ratio N2H+/N15NH+~ is similar to the elemental isotope ratio inferred for the local ISM, which was estimated to be 14N/15N = 290 ± 40 by Adande & Ziurys (2012) based on a survey of CN and HCN rotational lines. More recently, Ritchey et al. (2015) derived a local ISM value 14N/15N = 274 ± 18 from UV absorption lines of CN toward four lines of sight. Given the error bars, a ratio of ~300 would apply to the 16293E region. This similarity to local ISM values would imply an absence of chemical fractionation for N2H+ in this source in dense gas. The most recent gas-phase network of Roueff et al. (2015) suggested that the fractionation reaction of 15N with N2H+ is inefficient because there is an activation barrier, in contrast to the hypothesis made in previous models. In particular, the network of Hily-Blant et al. (2013b) does predict 15N enrichment in N2H+, in very good agreement with the present observation, but assumes a solar elemental ratio of 440. A 14N/15N value of ~300, however, might be more appropriate to describe the local ISM. In that case, the difference with the PSN value would be a consequence of the stellar nucleosynthesis that enriched the ISM in 15N atoms by ~50% during the last 4.5 Gy (Ritchey et al. 2015).
More observations are clearly needed to establish the actual elemental ratio in 16293E and to confirm or exclude nitrogen chemical fractionation in N2H+. In particular, observing various 15N-substituted molecules is important since it would allow us to distinguish between fractionation effects and a variation of the elemental abundance ratio from the mean local ISM value. In the first case, we expect to obtain a spread in the ratios, while in the second case, all the isotopic ratios should cluster around the same value.
More generally, it should be noted that gas-phase models of chemical fractionation are dependent on the temperature, on the chosen elemental abundances (especially the C/O ratio) and on the ortho-to-para ratio of H2 (Hily-Blant et al. 2013b; Le Gal et al. 2014; Roueff et al. 2015). It is also crucial to couple C, N, and O isotopic chemistries, as emphasized by Roueff et al. (2015). As a result, weak variations in chemical conditions can have a strong effect on the predicted molecular 14N/15N ratios. We note in this context that the temperature at the core center is higher in 16293E (~11 K), where N2H+/N15NH+ ~330, than in L1544 (~6 K), where N2H+/N15NH+ ~1000. It is unclear whether such a small temperature difference can play a role, but this should be investigated in detail in future dedicated studies. The wide spread observed in high-mass star-forming regions reported by Fontani et al. (2015) (N2H+/N15NH+ ~ 180−1300) might also reflect temperature or elemental abundance effects. It might also partly be due to the gradient of the 14N/15N abundance ratio with galactocentric distance (Adande & Ziurys 2012). The statistics of objects with a determination of the 14N/15N ratio in various molecules certainly has to be enlarged if we wish to answer the question of the origin of nitrogen fractionation in the solar system.
In molecular dynamics, the rotational quantum numbers are noted j, and J refers to the total angular momentum. However, in what follows, we use the spectroscopic notation and denote the rotational quantum number as J. This choice is made for consistency with the other parts of the article since the spectroscopist notation is usually adopted in astrophysical studies.
Acknowledgments
This work has been supported by the Agence Nationale de la Recherche (ANR-HYDRIDES), contract ANR-12-BS05-0011-01 and by the CNRS national program “Physico-Chimie du Milieu Interstellaire”. This work is based upon observations with the Caltech Submillimeter Observatory, operated by the California Institute of Technology. Support for this work was provided by NASA through an award issued by JPL/Caltech. The authors thank A. Castets for providing the N2H+ data acquired with the SEST telescope.
References
- Adande, G. R., & Ziurys, L. M. 2012, ApJ, 744, 194 [NASA ADS] [CrossRef] [Google Scholar]
- Arthurs, A. M., & Dalgarno, A. 1960, Proc. R. Soc. London, Ser. A, 256, 540 [Google Scholar]
- Bacmann, A., Daniel, F., Caselli, P., et al. 2016, A&A, 587, A26 [NASA ADS] [CrossRef] [EDP Sciences] [Google Scholar]
- Bizzocchi, L., Caselli, P., Leonardo, E., & Dore, L. 2013, A&A, 555, A109 [NASA ADS] [CrossRef] [EDP Sciences] [Google Scholar]
- Caselli, P., Myers, P. C., & Thaddeus, P. 1995, ApJ, 455, L77 [NASA ADS] [CrossRef] [Google Scholar]
- Castets, A., Ceccarelli, C., Loinard, L., Caux, E., & Lefloch, B. 2001, A&A, 375, 40 [NASA ADS] [CrossRef] [EDP Sciences] [Google Scholar]
- Charnley, S. B., & Rodgers, S. D. 2002, ApJ, 569, L133 [NASA ADS] [CrossRef] [Google Scholar]
- Daniel, F., & Cernicharo, J. 2008, A&A, 488, 1237 [NASA ADS] [CrossRef] [EDP Sciences] [Google Scholar]
- Daniel, F., Dubernet, M.-L., & Meuwly, M. 2004, J. Chem. Phys., 121, 4540 [NASA ADS] [CrossRef] [PubMed] [Google Scholar]
- Daniel, F., Dubernet, M.-L., Meuwly, M., Cernicharo, J., & Pagani, L. 2005, MNRAS, 363, 1083 [NASA ADS] [CrossRef] [Google Scholar]
- Daniel, F., Cernicharo, J., & Dubernet, M.-L. 2006, ApJ, 648, 461 [NASA ADS] [CrossRef] [Google Scholar]
- Daniel, F., Gérin, M., Roueff, E., et al. 2013, A&A, 560, A3 [NASA ADS] [CrossRef] [EDP Sciences] [Google Scholar]
- Dore, L., Bizzocchi, L., Degli Esposti, C., & Tinti, F. 2009, A&A, 496, 275 [NASA ADS] [CrossRef] [EDP Sciences] [Google Scholar]
- Dubernet, M.-L., Alexander, M. H., Ba, Y. A., et al. 2013, A&A, 553, A50 [NASA ADS] [CrossRef] [EDP Sciences] [Google Scholar]
- Dumouchel, F., Kłos, J., Toboła, R., et al. 2012, J. Chem. Phys., 137, 114306 [NASA ADS] [CrossRef] [Google Scholar]
- Faure, A., & Lique, F. 2012, MNRAS, 425, 740 [Google Scholar]
- Flower, D. R., & Lique, F. 2015, MNRAS, 446, 1750 [NASA ADS] [CrossRef] [Google Scholar]
- Fontani, F., Caselli, P., Palau, A., Bizzocchi, L., & Ceccarelli, C. 2015, ApJ, 808, L46 [NASA ADS] [CrossRef] [Google Scholar]
- Füri, E., & Marty, B. 2015, Nat. Geosc., 8, 515 [CrossRef] [Google Scholar]
- Gerin, M., Pearson, J. C., Roueff, E., Falgarone, E., & Phillips, T. G. 2001, ApJ, 551, L193 [NASA ADS] [CrossRef] [Google Scholar]
- Gerin, M., Marcelino, N., Biver, N., et al. 2009, A&A, 498, L9 [NASA ADS] [CrossRef] [EDP Sciences] [Google Scholar]
- Guzmán, V. V., Öberg, K. I., Loomis, R., & Qi, C. 2015, ApJ, 814, 53 [NASA ADS] [CrossRef] [Google Scholar]
- Hily-Blant, P., Bonal, L., Faure, A., & Quirico, E. 2013a, Icarus, 223, 582 [Google Scholar]
- Hily-Blant, P., Pineau des Forêts, G., Faure, A., Le Gal, R., & Padovani, M. 2013b, A&A, 557, A65 [NASA ADS] [CrossRef] [EDP Sciences] [Google Scholar]
- Hutson, J. M., & Green, S. 1994, MOLSCAT computer code, version 14, distributed by Collaborative Computational Project No. 6 of the Engineering and Physical Sciences Research Council (UK) [Google Scholar]
- Ikeda, M., Hirota, T., & Yamamoto, S. 2002, ApJ, 575, 250 [NASA ADS] [CrossRef] [Google Scholar]
- Le Gal, R., Hily-Blant, P., Faure, A., et al. 2014, A&A, 562, A83 [NASA ADS] [CrossRef] [EDP Sciences] [Google Scholar]
- Lique, F., Daniel, F., Pagani, L., & Feautrier, N. 2015, MNRAS, 446, 1245 [NASA ADS] [CrossRef] [Google Scholar]
- Lis, D. C., Gerin, M., Phillips, T. G., & Motte, F. 2002, ApJ, 569, 322 [NASA ADS] [CrossRef] [Google Scholar]
- Lis, D. C., Wootten, A., Gerin, M., & Roueff, E. 2010, ApJ, 710, L49 [NASA ADS] [CrossRef] [Google Scholar]
- Lyons, J. R., Bergin, E. A., Ciesla, F. J., et al. 2009, Geochim. Cosmochim. Acta, 73, 4998 [NASA ADS] [CrossRef] [Google Scholar]
- Pagani, L., Daniel, F., & Dubernet, M.-L. 2009, A&A, 494, 719 [NASA ADS] [CrossRef] [EDP Sciences] [Google Scholar]
- Ritchey, A. M., Federman, S. R., & Lambert, D. L. 2015, ApJ, 804, L3 [NASA ADS] [CrossRef] [Google Scholar]
- Rodgers, S. D., & Charnley, S. B. 2004, MNRAS, 352, 600 [NASA ADS] [CrossRef] [Google Scholar]
- Rodgers, S. D., & Charnley, S. B. 2008, ApJ, 689, 1448 [NASA ADS] [CrossRef] [Google Scholar]
- Roueff, E., Loison, J. C., & Hickson, K. M. 2015, A&A, 576, A99 [NASA ADS] [CrossRef] [EDP Sciences] [Google Scholar]
- Rousselot, P., Pirali, O., Jehin, E., et al. 2014, ApJ, 780, L17 [NASA ADS] [CrossRef] [EDP Sciences] [Google Scholar]
- Schöier, F. L., van der Tak, F. F. S., van Dishoeck, E. F., & Black, J. H. 2005, A&A, 432, 369 [NASA ADS] [CrossRef] [EDP Sciences] [Google Scholar]
- Scribano, Y., Faure, A., & Wiesenfeld, L. 2010, J. Chem. Phys., 133, 231105 [NASA ADS] [CrossRef] [Google Scholar]
- Spielfiedel, A., Senent, M. L., Kalugina, Y., et al. 2015, J. Chem. Phys., 143, 024301 [NASA ADS] [CrossRef] [Google Scholar]
- Terzieva, R., & Herbst, E. 2000, MNRAS, 317, 563 [NASA ADS] [CrossRef] [Google Scholar]
- Wampfler, S. F., Jørgensen, J. K., Bizzarro, M., & Bisschop, S. E. 2014, A&A, 572, A24 [NASA ADS] [CrossRef] [EDP Sciences] [Google Scholar]
- Wirström, E. S., Charnley, S. B., Cordiner, M. A., & Milam, S. N. 2012, ApJ, 757, L11 [NASA ADS] [CrossRef] [Google Scholar]
All Figures
|
Fig. 1 Temperature variation of the hyperfine resolved N2H+–H2(j = 0) (solid lines) and N15NH+–H2(j = 0) (dotted lines) rate coefficients for j = 2,F → j′ = 1,F′ and j = 3,F → j′ = 2,F′ transitions. |
| In the text | |
|
Fig. 2 Comparison between model and observations for the SEST (bottom panel) and IRAM (middle panel) N2H+J = 1−0 line. The top panel shows the CSO N2H+J = 3−2 line. In each panel, we show the offset between the position observed and the core center. For each spectrum, the gray area indicates the variation of intensity obtained by varying the N2H+ abundance as indicated in Fig. 5. |
| In the text | |
|
Fig. 3 Comparison between model and observations for the N2H+(J = 1−0) map observed at SEST. In each panel, the distance to the core center is indicated in arcseconds at the upper left side of the box. The reference coordinates of the map are α = 16h32m22.76s, δ = –24°28′33.1″ (J2000), as given in Castets et al. (2001), which corresponds to a position close to the 16293-2422 protostar. This protostar is located ~90′′ northwest of the 16293E core center. |
| In the text | |
|
Fig. 4 Comparison between model and observations for the N2H+(J = 3−2) map observed at CSO. In each panel, the distance to the core center is indicated in arcseconds in the upper left side of the box. The reference coordinates of the map are α = 16h32m28.83s, δ = –24°28′56.9″ (J2000), which is located ~7′′ away from the position we assume for the core center. |
| In the text | |
|
Fig. 5 N2H+ abundance profile. |
| In the text | |
|
Fig. 6 Comparison between model and observations for the N15NH+J = 1−0 line. |
| In the text | |
Current usage metrics show cumulative count of Article Views (full-text article views including HTML views, PDF and ePub downloads, according to the available data) and Abstracts Views on Vision4Press platform.
Data correspond to usage on the plateform after 2015. The current usage metrics is available 48-96 hours after online publication and is updated daily on week days.
Initial download of the metrics may take a while.