Fig. 2
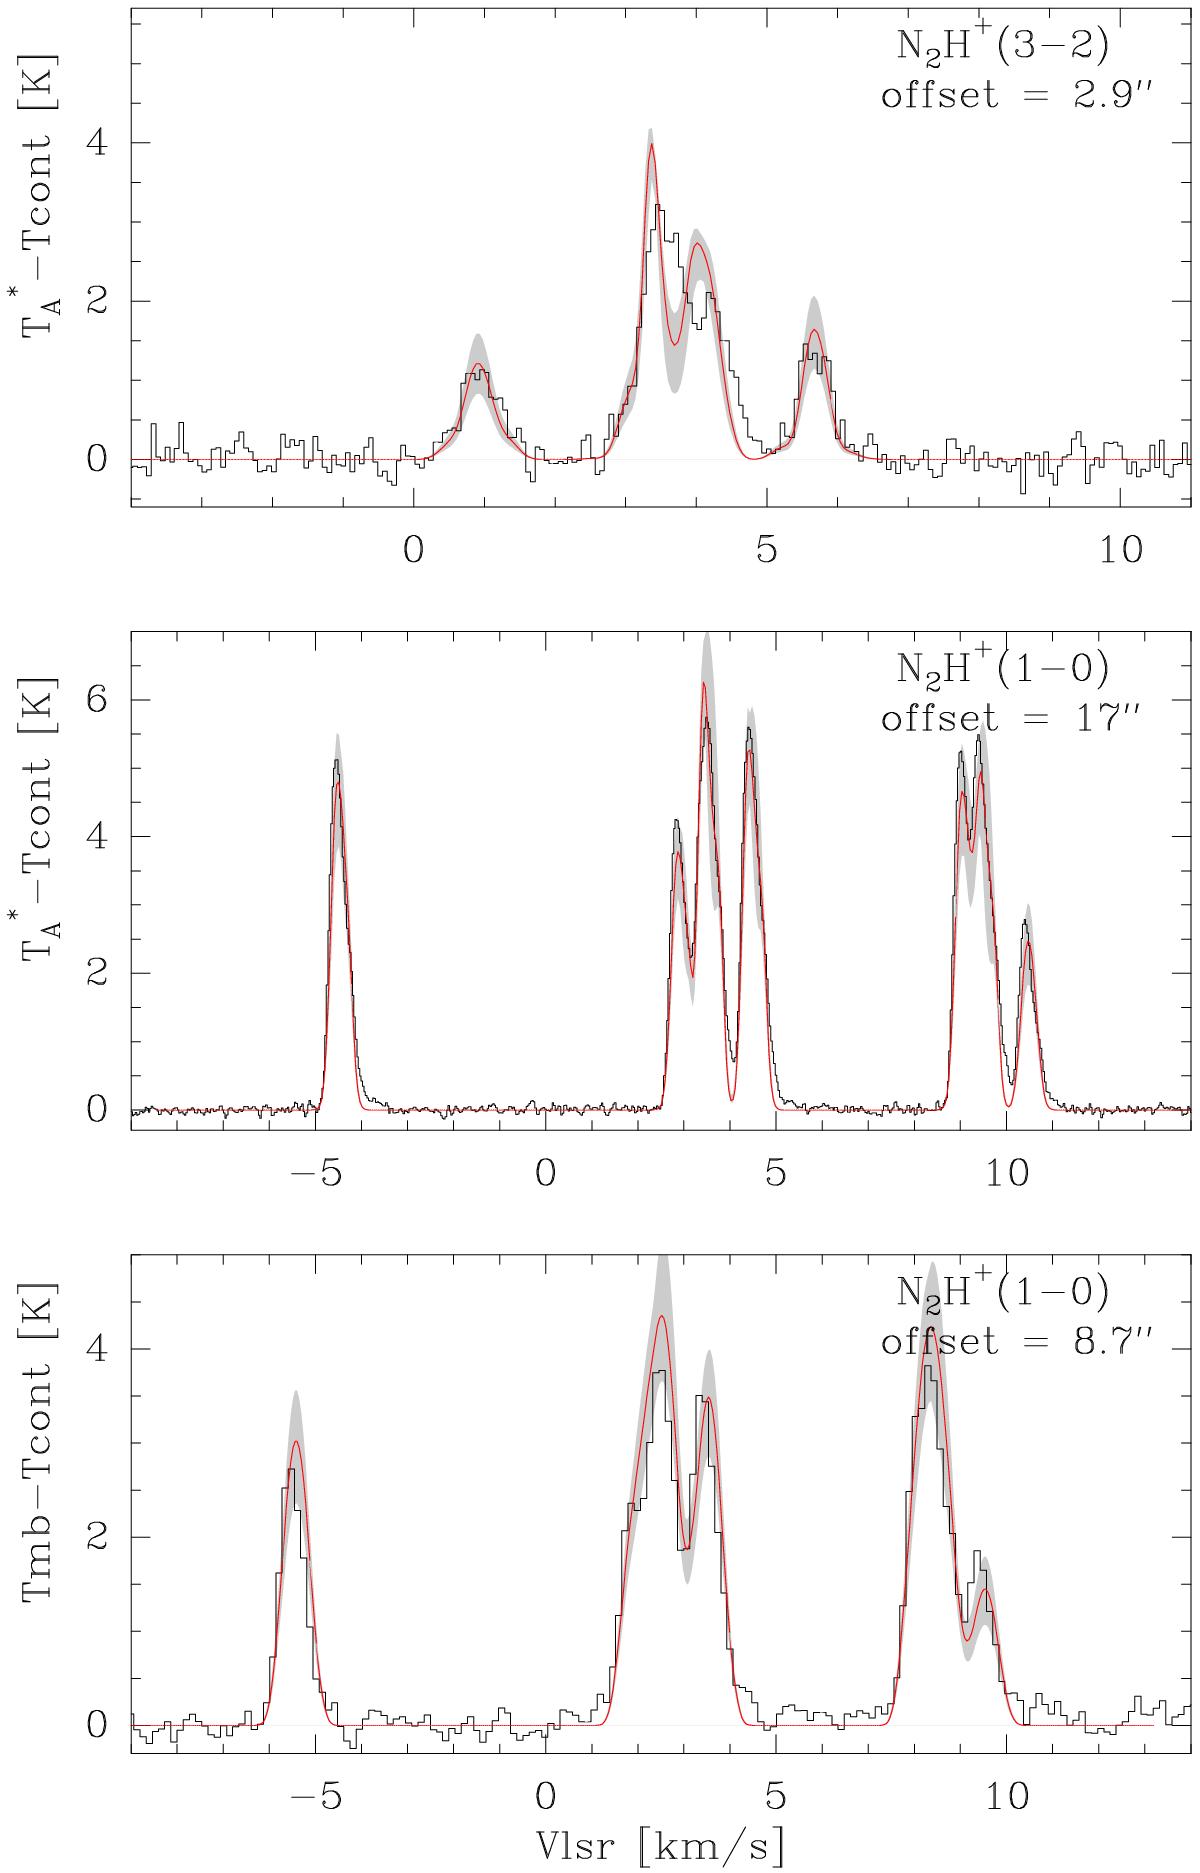
Comparison between model and observations for the SEST (bottom panel) and IRAM (middle panel) N2H+J = 1−0 line. The top panel shows the CSO N2H+J = 3−2 line. In each panel, we show the offset between the position observed and the core center. For each spectrum, the gray area indicates the variation of intensity obtained by varying the N2H+ abundance as indicated in Fig. 5.
Current usage metrics show cumulative count of Article Views (full-text article views including HTML views, PDF and ePub downloads, according to the available data) and Abstracts Views on Vision4Press platform.
Data correspond to usage on the plateform after 2015. The current usage metrics is available 48-96 hours after online publication and is updated daily on week days.
Initial download of the metrics may take a while.