| Issue |
A&A
Volume 592, August 2016
|
|
|---|---|---|
| Article Number | A67 | |
| Number of page(s) | 17 | |
| Section | Interstellar and circumstellar matter | |
| DOI | https://doi.org/10.1051/0004-6361/201527937 | |
| Published online | 26 July 2016 | |
Laser desorption time-of-flight mass spectrometry of vacuum UV photo-processed methanol ice
Raymond and Beverly Sackler Laboratory for Astrophysics, Leiden Observatory, Leiden University, PO Box 9513, 2300 RA Leiden, The Netherlands
e-mail: dmpaardekooper@strw.leidenuniv.nl
Received: 9 December 2015
Accepted: 10 May 2016
Context. Methanol in the interstellar medium mainly forms upon sequential hydrogenation of solid CO. With typical abundances of up to 15% (with respect to water) it is an important constituent of interstellar ices where it is considered as a precursor in the formation of large and complex organic molecules (COMs), e.g. upon vacuum UV (VUV) photo-processing or exposure to cosmic rays.
Aims. This study aims at detecting novel complex organic molecules formed during the VUV photo-processing of methanol ice in the laboratory using a technique more sensitive than regular surface diagnostic tools. In addition, the formation kinetics of the main photo-products of methanol are unravelled for an astronomically relevant temperature (20 K) and radiation dose.
Methods. The VUV photo-processing of CH3OH ice is studied by applying laser desorption post-ionisation time-of-flight mass spectrometry (LDPI TOF-MS), and analysed by combining molecule-specific fragmentation and desorption features.
Results. The mass spectra correspond to fragment ions originating from a number of previously recorded molecules and from new COMs, such as the series (CO)xHy+, with x = 3 and y < 3x−1, to which prebiotic glycerin belongs. The formation of these large COMs has not been reported in earlier photolysis studies and suggests that such complex species may form in the solid state under interstellar conditions.
Key words: astrobiology / astrochemistry / molecular processes / methods: laboratory: solid state / ISM: molecules / ultraviolet: ISM
© ESO, 2016
1. Introduction
In the interstellar medium, methanol (CH3OH) is considered to be an important solid state precursor species in the formation of complex organic molecules (COMs; van Dishoeck 2014). Methanol is mainly formed through sequential hydrogenation of CO ice on top of cold dust grains, a process well studied in the laboratory (Watanabe & Kouchi 2002; Fuchs et al. 2009; Chuang et al. 2016). This is fully consistent with astronomical observations, indicating that solid CH3OH is abundant and predominately mixed with CO inside the ice mantle (Cuppen et al. 2011; Boogert et al. 2015).
Upon (non)energetic processing, such interstellar ices become chemically active. Typically, atom-addition reactions or recombination reactions of fragments formed upon vacuum UV (VUV) irradiation, cosmic ion bombardment, or electron-impact result in the formation of new species. These processes have been simulated in different laboratories (Gerakines et al. 1996; Baratta et al. 2002; Bennett & Kaiser 2007; Öberg et al. 2009; Hama & Watanabe 2013; Islam et al. 2014; Boamah et al. 2014; Maity et al. 2014, 2015; Linnartz et al. 2015; Chuang et al. 2016; Mrad et al. 2016). These studies apply infrared (IR) spectroscopy (transmission or reflection) and temperature programmed desorption (TPD) combined with either quadrupole mass spectrometry (QMS), single photon ionisation time-of-flight mass spectrometry (SPI TOF-MS), or gas chromatography coupled to mass spectrometry (GC-MS). Several recent studies have shown how new products form upon processing of CH3OH rich ices. In Baratta et al. (2002), Bennett & Kaiser (2007), Islam et al. (2014), Boamah et al. (2014), Maity et al. (2014, 2015), Henderson & Gudipati (2015) the role of electron or ion bombardment has been studied and in Gerakines et al. (1996), Hudson & Moore (2000), Baratta et al. (2002), Moore & Hudson (2005), Öberg et al. (2009), Islam et al. (2014), Henderson & Gudipati (2015), Mrad et al. (2016) VUV photolysis has been characterised. An overview of species detected in recent laboratory studies focusing on methanol ice processing is shown in the first four columns of Table 1. It is clear that all these solid state processes offer pathways towards molecular complexity in space. The techniques used for these identifications are powerful, sophisticated, and reliable. They have provided detailed insights into the processes at play, but every detection scheme comes with limitations, especially when low temperatures are involved. In situ IR spectroscopy, for example, holds the risk of overlapping bands or non-detections because of IR inactive modes. Ice destruction is inherent to TPD, which in parallel – like GC-MS – may induce thermally induced reactions. Recently, complementary detection schemes have become available that attempt to obtain new information from different perspectives on processed interstellar ice analogues (Paardekooper et al. 2014; Henderson & Gudipati 2015; Bossa et al. 2015).
Overview of recent studies focusing on energetically processing methanol ice using a variety of detection techniques.
In the present study, we apply laser desorption post-ionisation time-of-flight mass spectrometry (LDPI TOF-MS) to gain additional insights into the photo-products of VUV processed CH3OH ice. This technique has distinct advantages over the traditional techniques: (i) Compared to infrared spectroscopy, this technique has an improved sensitivity (several orders of magnitude) and for a number of applications, the method is also more molecule selective. In addition, since ionisation is realised through energetic electrons, a quantitative analysis becomes possible since electron-impact cross sections of different species are known from literature; (ii) Compared to regular TPD methods the total composition of the ice at any given temperature can be tracked; and (iii) Any thermally induced reactions during TPD can be largely excluded. However, the interpretation of the LDPI TOF-MS data, is not straightforward and this is discussed below.
This paper is organised as follows. Section 2 presents a brief description of the experimental set-up and provides a detailed description of the data analysis performed. Section 3 presents the qualitative and quantitative interpretation of the experimental results. In Sect. 4, the results are compared to conclusions from other studies available in the literature. In Sect. 5, the astrophysical implications are discussed and the main findings are summarised. In the Appendix the difference spectra are shown for all the species identified in this study.
2. Experiments and analysis
2.1. Experiments
The experiments were carried out in our ultrahigh vacuum (UHV) set-up, MATRI2CES (Mass Analytical Tool to study Reactions in Interstellar ICES), previously described in detail by Paardekooper et al. (2014). MATRI2CES consists of two UHV chambers, the main chamber for ice preparation and ice processing and a time-of-flight chamber. The base pressure of these chambers is in the 10-10 mbar range. In the main chamber a gold-coated copper substrate is in thermal contact with a closed-cycle helium cryostat, enabling substrate-temperatures down to 20 K. An accurate temperature control is achieved using a thermocouple and heating element, combined with a LakeShore-temperature regulator (model 331). Ices are grown on the substrate by leaking in gas-phase species through an all-metal needle valve attached to a capillary. Residual gasses trapped in liquid samples such as methanol, CH3OH (Sigma Aldrich, 99.8%), and 13-methanol 13CH3OH (Sigma Aldrich, 99%) are removed by several freeze-pump-thaw cycles. The deposition rate of methanol was determined in advance by HeNe laser interference measurements (Baratta & Palumbo 1998), using a refractive index of n = 1.33 (Weast 1972). The substrate is stationary during deposition of the ice. Typical deposition times are 5 min and the ice growth is stopped when an ice thickness of ~13.5 nm is reached; this corresponds to ~40 monolayers (1 ML = 1015 molecules cm-2).
MATRI2CES deploys LDPI TOF-MS as a detection scheme to study new molecules formed in the VUV photo-processed ice. Desorption of the ice sample is induced using the unfocused, skimmed beam (~ 1 mm) of the third harmonic of a Nd:YAG laser (355 nm with a pulse length of 4−5 ns). An attenuator is used to reduce the energy of the laser pulses. Typical laser pulse energies are of the order of 30 mJ cm-2. The desorbed species are subsequently ionised by an electron gun, with a mean energy of either 35 or 70 eV. Since this energy exceeds the ionisation potential of molecules, this predominately results in dissociative ionisation. The generated ions are extracted by ion optics, situated in close proximity to the substrate. Subsequently, ions enter a field-free flight tube, which allows the ions to drift and to separate based on their mass-to-charge ratios (m/z), after which they are detected by a micro-channel plate (MCP). In the current configuration the mass resolution (M/ ΔM) is about 400 (Paardekooper et al. 2014). Multiple desorption events for each ice sample are possible, since the cryostat is situated on top of two UHV translators, i.e. different surface areas are probed for subsequent desorption events. Typically 220 ablation events are measured along a column of 20 mm and this is repeated for nine columns. This guarantees that only the VUV photoprocessed ice region is studied (in principle it is possible to monitor a larger surface area). The columns are separated by 1.25 mm, i.e. there is no overlap of laser ablated ice surfaces between different columns. However, along one column subsequent ablation spots do overlap. This could cause problems as the beam is unfocused and the same ice spot is hit by overlapping laser pulses. However, no substantial changes were found for lower laser repetition rates and identical translation speed, i.e. for conditions where the spatial overlap decreases. Therefore, the data acquisition is operated for 220 spots, and this high number allows the S/N to increase. Throughout the article, we will use “mass spectra” when referring to LDPI TOF-MS data.
Vacuum UV photo-processing is performed using a flowing H2 microwave discharge lamp. Typical settings are 0.85 mbar and 80 W of applied microwave power. The lamp is attached to a MgF2 UHV window directly facing the substrate; the distance between the window and the substrate is 14 cm. In a number of recent studies the spectral emission distribution of this lamp has been characterised in detail (Chen et al. 2014; Es-sebbar et al. 2015; Ligterink et al. 2015). The spectral energy distribution is shown in Fig. 1. The flux at sample location is (3 ± 1) × 1013 photons cm-2 s-1; the spectral energy distribution peaks at Lyman-α (~121 nm) and around 160 nm. The VUV irradiation can be stopped at different times, i.e. for different total fluences, after which a mass spectrum can be recorded. This method can also characterise the photolysis kinetics of the precursor methanol and reaction products. Typical irradiation times amount to a few hours, i.e. much shorter than in other photolysis experiments (Bernstein et al. 2002; Muñoz Caro et al. 2002; Mrad et al. 2016).
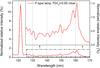 |
Fig. 1 Spectral energy distribution of the VUV lamp (116–170 nm) described in the text (Ligterink et al. 2015). |
2.2. Analysis
The acquired mass spectra are first discussed in a qualitative way, as a quantitative interpretation is complicated by the fragmentation upon electron-impact ionisation. We follow a three-step approach. First, MATRI2CES is used to record the reference fragmentation patterns of the majority of the species expected to form upon VUV photolysis of methanol ice. These measurements are performed for two electron-impact energies, 35 and 70 eV. This is described in Sect. 2.2.1. The second step, described in Sect. 2.2.2, is to obtain mass spectra of irradiated methanol ice at elevated temperatures. Since different molecules sublime at different temperatures, we can link the relative decrease in intensity for the mass peaks with temperature to specific molecules. This step determines which species should be considered for the inclusion in the quantitative fit of the mass spectra, recorded for 20 K. By combining all the information in the final step, the low-temperature photolysis data of methanol can be interpreted to obtain the abundances and kinetics of individual species; the fitting procedure is described in Sect. 2.2.3.
2.2.1. Reference experiments
The NIST database1 provides a guideline for the fragmentation of species at 70 eV electron-impact energy. For a more precise analysis it is necessary to derive set-up specific dissociative ionisation patterns (Schwarz-Selinger et al. 2001). Therefore, we measured the fragmentation pattern of most of the species that we expect to form during the VUV irradiation of CH3OH ice in MATRI2CES. The candidate species (Table 2) were selected based on studies of processed CH3OH ice available in the literature (Öberg et al. 2009; Boamah et al. 2014; Maity et al. 2015). Using two different ionisation energies (35 and 70 eV) provides additional information. Owing to experimental limitations, the reference fragmentation patterns of species with negligible vapour pressure could not be recorded. The maximum number of fragment ions is produced at 70 eV since the de Broglie wavelength of the electrons is similar to the intramolecular bond length. A lower electron energy (35 eV) was also used since the fragmentation patterns differ from 70 eV while maintaining a relative high ion yield. Attempts to record mass spectra for electron energies near the ionisation potential (10–15 eV) were not successful because for these low energies both the electron densities and corresponding cross sections rapidly drop.
Properties and sample purities of potential photoproducts of VUV-irradiated methanol ice.
2.2.2. Experiments at elevated temperature
Additional information is obtained by taking into account that different ice constituents desorb at different temperatures. For this, we recorded a mass spectrum (70 eV) after irradiating methanol ice (20 K) for 64 min. Subsequently, the VUV irradiated ice was slowly (2.5 K min-1) heated to 50 K, and was left to settle for 15 min. At this elevated temperature, CO and CH4 thermally desorb, but molecules trapped inside the methanol matrix do not. Changes in the resulting mass spectrum summarised in the mass difference graphs reflect the loss of evaporated ice constituents (see the Appendix). The decline of the dominant peaks of the reference fragmentation patterns confirms the presence of this molecule in the methanol irradiated ice. In this way, more species can be positively identified by using selected sets of temperatures that include the thermal desorption values of a large number of species (see Table 2). Here temperature ranges of 20–50, 50–100, 100–125, 125–150, 150–175, and 175–210 K are probed separately.
2.2.3. Fitting
Mass spectra are measured for different VUV fluences. A baseline correction is performed by fitting a baseline through an array of points where no mass signal is recorded. Subsequent integration of the individual peaks yields the total intensity of every single mass. Each of these mass spectra can be regarded as a linear combination of fragment ions from n individual compounds present in the ablated material,  (1)where MSt,E is the mass spectrum acquired after a specific irradiation time t, i.e. specific VUV fluence, and electron energy E; ai corresponds to the fitted mole fraction of a constituent i; and σi,E and MSi,E are the corresponding electron-impact cross section and the reference mass spectrum, respectively. The fitting procedure is performed with Matlab 7.9.0 (R2009b) using the Nelder-Mead optimisation algorithm (Lagarias et al. 1998).
This method has recently been applied to interpret the VUV photo-processing of methane (CH4; Paardekooper et al. 2014; Bossa et al. 2015). The method is here extended to fit Eq. (1) to the mass spectra recorded for two different electron energies, E. As the two different electron energies result in different fragmentation patterns, this adds extra constraints to the fit. Candidate species for the fitting library are selected based on their presence in experiments performed at elevated temperatures (see Sect. 2.2.2).
This procedure comes with the shortcoming that possibly not all formed constituents are actually included in the fit, but we explicitly assume that these missing species are not formed in high abundances and consequently we expect that the overall accuracy of the fit is not strongly affected.
3. Experimental results
This section is divided into two parts. Section 3.1 describes a qualitative interpretation of the obtained mass spectra. Section 3.2 continues with a quantitative interpretation based on the approach described in Sect. 2.2.
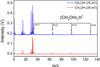 |
Fig. 2 Reference mass spectra of ~13.5 nm-thick CH3OH ice deposited at 20 K, using 35 eV (red) and 70 eV (blue) electrons as an ionisation source. |
3.1. Qualitative analysis
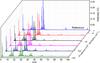 |
Fig. 3 Mass spectra of ~13.5 nm-thick methanol ice deposited at 20 K, using 70 eV electrons as an ionisation source at different VUV fluences. The VUV fluence is plotted on a log scale; for clarity the reference spectrum is presented at the origin. |
3.1.1. Unprocessed CH3OH ice
The mass spectra of unprocessed CH3OH ice upon 35 and 70 eV electron impact ionisation are shown in Fig. 2. Clear differences are visible in the number of ions detected and the relative intensities for the different fragmentation channels. Comparing the 70 eV mass spectrum to the NIST database, the observed fragmentation pattern is in agreement within 15%. Such a small mismatch is expected for different experimental set-ups, as the exact values depend on the geometry of the ion source, the temperature of the filament, and the distribution in electron energies (Schwarz-Selinger et al. 2001). Moreover, protonated methanol-clusters are observed, for example at m/z = 65, 97, and 129 in Fig. 2. These originate from the clustering reaction,  (2)Focsa & Destombes (2001) showed that cluster formation in laser-induced desorption experiments of concentrated and polar molecules can take place; for pure methanol ice this has also been reported by Henderson & Gudipati (2015), and it is straightforward to identify the cluster mass since the main component of the ice is known. This changes when the ice is VUV processed and the resulting ice constituents are not fully known. The figure shows that it is important to take the presence of cluster ions into account when interpreting the mass signals.
3.1.2. VUV processed CH3OH ice
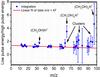 |
Fig. 4 Intensity ratio of low to high laser pulse energy. A 2σ-error bar is shown. |
In Fig. 3, mass spectra are shown for CH3OH ice for different VUV fluences. As soon as the irradiation starts, the number of peaks at higher masses increases, which indicates that COMs are formed in the ice. At m/z = 63 and 95, mass peaks two m/z units below the mass value of protonated methanol dimer and trimer, a clear increase in intensity is observed. These have been assigned earlier to methanol oxidation products, clustering with methanol (Henderson & Gudipati 2015). To discriminate between cluster peaks and photo-products, we performed two experiments with different laser pulse energies, as this results in different densities in the desorption plume (Paardekooper et al. 2014), and also influences the intensity of the cluster peaks. All m/z containing ion counts in the spectra are integrated, and the fraction of both high and low laser pulse energy mass signals is presented in Fig. 4. At low m/z values (<47), with the exception of m/z = 33 (CH3OH)H+, no cluster signals are present. The signals in that region originate from photoproducts present in the ice. Therefore, by linearly extrapolating the reliable low-mass products (<47), it is possible to discriminate between mass peaks originating from clusters and from products. Based on this approach, we attribute the origin of the following masses predominantly to clusters: m/z = 33, 63, 65, 75, 79, 93, 95, and 97. We can directly assign 33, 65, and 97 to the protonated methanol clusters, (CH3OH)nH+. From previous work (Henderson & Gudipati 2015), m/z values at 59, 61, 73, 77, 89 and 91 are also expected to contain at least small cluster contributions. For our experimental conditions, however, we do not find strong experimental evidence of clustering at these m/z values. The remaining peaks are direct evidence of the formation of new species, including larger COMs, which is the topic of this study.
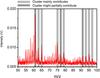 |
Fig. 5 Mass spectrum of ~13.5 nm-thick methanol ice deposited at 20 K, photo-processed for 128 min corresponding with a fluence of (2.3 ± 0.8) × 1017 photons cm-2 using 70 eV electrons as an ionisation source. |
In Fig. 5, a mass spectrum is shown where the methanol ice has been processed with VUV photons for 128 min leading to a fluence of (2.3 ± 0.8) × 1017 photons cm-2. Mass signals from cluster ions are indicated and it is clear that new mass peaks are detected in the range of m/z = 85...91. These peaks likely originate from (CO)xH , with x = 3 and y< 3x−1. This result proves that the parent molecules leading to these fragment ions contain at least a total of six carbon or oxygen atoms. This finding is important as to date no low temperature (20 K) in situ studies have reported COMs in this size range upon relatively short VUV photolysis of pure methanol ice. Previous results, including the findings in the recent study by Mrad et al. (2016), were realised after irradiation of an ice mixture for days, using gas chromatography to identify the chemical components of the resulting residue (Muñoz Caro et al. 2002; Bernstein et al. 2002; Briggs et al. 1992). The present study shows in situ and in real time that large complex species are indeed formed. Other studies on the processing of methanol ice with electrons (Boamah et al. 2014; Maity et al. 2015; Kaiser et al. 2015), using QMS or SPI TOF-MS combined with TPD, find larger species as well, but as in the case of the GC-MS studies special care is needed to exclude that new species are thermally formed during the warm-up phase.
3.1.3. VUV processed CH3OH and 13CH3OH ice
Figure 6 presents the mass spectra of VUV photo-processed CH3OH and 13CH3OH ices. The 12C →13C isotopic shifts are a guide in determining the number of carbon atoms reflected by particular peaks. This supports, for example, the assignment of the cluster m/z = 65 to (CH3OH)2H+ since this mass shifts to m/z = 67. The mass peak at m/z = 75 shifts to m/z = 78, indicating that the corresponding fragment ion consists of three carbon and two oxygen atoms.
The peak intensities shown in Fig. 6 are integrated, and are correlated with respect to the isotopic shift, CnOmH and 13CnOmH, with n = 1..2 and m = 0...n. For example, one data point is the integrated area of 12CH+ with respect to 13CH+; another is 12C2H2O+ with respect to 13C2H2O+. The corresponding correlation diagram is shown in the inset of Fig. 6, and confirms a good correlation between carbon content and the chosen assignment.
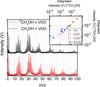 |
Fig. 6 Mass spectrum of ~13.5 nm-thick methanol ice (CH3OH and 13CH3OH) deposited at 20 K, using 70 eV electrons as an ionisation source, irradiated for 64 min and corresponding fluence: (1.2 ± 0.4) × 1017 photons cm-2. The inset depicts the correlation of the peak intensities between the two experiments,i.e. 12CHy vs. 13CHy. |
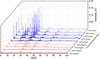 |
Fig. 7 Overview of the mass spectra of VUV processed methanol ice acquired at different temperatures, using 70 eV electrons as an ionisation source. The fluence level is noted in brackets. Low fluence corresponds to (1.2 ± 0.4) × 1017 photons cm-2 and high fluence to (5 ± 2) × 1017 photons cm-2 (estimated). The high-fluence experiment follows a different experimental procedure: simultaneous deposition (~240 ML) and photolysis (4 h). |
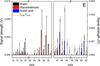 |
Fig. 8 Ion mass fragmentation signals (black, red, and blue filled boxes) and integrated mass difference signal (open boxes) for T = 150 and 175 K are shown for the m/z peaks that correspond to ion fragment masses of water, glycolaldehyde, and acetic acid for 70 eV electron impact. The derived uncertainty level is indicated for each difference signal. |
3.2. Quantitative analysis
A quantitative interpretation of the data presented in the previous paragraphs is not straightforward. Different photo-products fragment into similar masses upon electron impact ionisation, which complicates the analysis. However, as explained in Sect. 2.2.3, it is possible to incorporate another molecule-specific parameter as a diagnostic tool, namely the desorption temperature. In the paragraphs below, the photo-products are assigned using this extra information, and the mass spectra are interpreted in terms of the set-up specific reference fragmentation patterns. This allows a fitting library to be created for both the 35 and 70 eV electron-impact ionisation experiments. The resulting data are used as input to interpret the mass spectra of the photo-processed methanol ice at 20 K and to determine which new species are formed.
3.2.1. Assignment of photolysis products
In order to confirm the presence of different photoproducts, we have conducted experiments in which we first VUV irradiate CH3OH ice at 20 K for 64 min, corresponding to a fluence of (1.2 ± 0.4) × 1017 photons cm-2. Subsequently, before and after increasing the substrate temperature, mass spectra are recorded using 70 eV electrons as an ionisation source. The strategy is to visualise the thermally induced decrease in the dominant peaks in the reference fragmentation pattern and to link this to a specific reaction product, based on the temperature range where a decrease is observed. In addition to the decrease caused by desorption, other changes in the ice can also affect the peak intensities, such as local rearrangement and phase changes of the ice structure. The desorption temperature of different species is listed in Table 2. The desorption profiles are typically wide and can therefore cause overlap between temperature gaps.
To strengthen the assignment of species with desorption temperatures higher than methanol (~130 K) we conducted an experiment following a different procedure. After reaching a substrate temperature of 20 K, we deposited methanol with a slow deposition rate (~1 ML/min) for a duration of 4 h, while simultaneously exposing the sample to VUV photons. In our experimental conditions this approach yields a higher energy deposit per molecule and a thicker layer of processed ice (~240 ML). In turn, a larger abundance of COMs is obtained. Subsequently, the temperature was ramped up to 150, 175, 200, and 210 K. Mass spectra were recorded for all temperatures. Figure 7 provides an overview of both low- and high-fluence experiments. Up to 150 K, the spectra show the previously mentioned protonated methanol clusters. Above this temperature, these signals nearly vanish.
In order to characterise new photoproducts, we compare the difference in absolute intensity of individual mass peaks to reference mass spectra between 20 and 50 K (A), 50 and 100 K (B), 100 and 125 K (C), 125 and 150 K (D), 150 and 175 K (E), and 175 and 210 K (F). All figures with the resulting mass difference spectra are summarised in the Appendix. Here only one figure is shown as an illustrating example (Fig. 8), covering 150 to 175 K (i.e. range E).
Figure 8 compares the reference fragmentation patterns of water, glycolaldehyde, and acetic acid with the absolute difference between the mass spectra obtained at 150 and 175 K. These species are selected based on their desorption temperature in this temperature range (see also Table 2). It is clear that H2O desorbs from the substrate; therefore, we confirm that H2O is formed during the irradiation of CH3OH-ice. The majority of the intensity differences is in agreement with the fragmentation patterns of glycolaldehyde and acetic acid, although differences are found for m/z = 29, 31, 44, 45, and 46. These may be due to remaining ethanol still present at 150 K (Öberg et al. 2009). In the sections below, the different temperature regimes with corresponding desorbing molecules are discussed separately.
A (20–50 K): identification of CO and CH 4
The difference in peak intensity between the spectra acquired at 20 and 50 K is compared with the reference fragmentation patterns of CO and CH4 (Fig. A.1). After this temperature increase, a minor intensity decrease is observed in the mass range 12 to 16, indicating that part of the CH4 formed in the ice has desorbed. We do not observe a clear decrease at m/z = 28, although it is expected that CO forms during photo-processing. Methane and carbon monoxide have been detected previously in photolysis studies using IR spectroscopy (Gerakines et al. 1996; Öberg et al. 2009). The limited decrease in intensity observed in our experiment is due to the large fraction of the species trapped in the methanol matrix; this has previously been observed with reflection-absorption IR spectroscopy (RAIRS) studies. At higher temperatures (100 K, as depicted in Fig. A.2) m/z = 28 clearly decreases. Some other m/z values show a minor decrease; it is expected that this is caused by local rearrangement in the ice structure.
B (50–100 K): identification of H 2 CO, CH 3 OCH 3 , and CO 2
Figure A.2 presents the difference in integrated intensity between mass spectra obtained at 50 and 100 K compared with reference fragmentation patterns of formaldehyde, dimethyl ether, and carbon dioxide. A decrease in the main fragmentation peaks of formaldehyde is observed. We also observe a decrease at m/z = 44, 45, and 46 indicating that CH3OCH3 has started desorbing from the ice. The decrease at m/z = 44 is consistent with the presence of carbon dioxide. Moreover, signal decreases at m/z = 26, 27, 42, and 43 are observed; m/z = 26 and 27 possibly originate from the fragmentation of ethane (C2H6), but an unambiguous assignment is not possible since the fragmentation pattern does not fully match. The decreased intensity at m/z = 42 and 43 is unexpected and not fully understood. The molecules H2CO and CO2 have been observed in several photolysis studies (Gerakines et al. 1996; Öberg et al. 2009) and CH3OCH3 has been detected by Öberg et al. (2009).
C (100–125 K): identification of HCOOCH 3 and CH 3 CHO
Figure A.3 presents the changes in mass spectra during the temperature increase from 100 to 125 K compared to the reference fragmentation patterns of HCOOCH3, CH3CHO, and CH3OCH3. An intensity decrease at m/z = 44, 45, 46, and 58 up to 63 is observed. Part of this decrease is explained by the desorption of methyl formate for m/z = 59, 60, and 61, in agreement with the reported desorption temperature. We tentatively assign the decrease at m/z = 44 to the desorption of acetaldehyde (CH3CHO), although it is clear that only a minor amount of this species is formed, in agreement with Öberg et al. (2009). It should be noted that during this temperature increase, a phase change to crystalline CH3OH occurs (Bolina et al. 2005; Isokoski et al. 2014). Owing to this local rearrangement of the ice structure, trapped species can be released to the gas phase (Maity et al. 2015). The local density of different species in the plume changes, and this affects the intensities at m/z = 61 and 63 (not depicted). The decrease at m/z in the 44–46 range is attributed to remaining dimethyl ether, which is expected to be still present in the ice. The desorption profiles are typically wide and therefore can contribute in two different temperature regimes, determined by the boundary values chosen here.
D (125–150 K): identification of CH 3 OH, CH 3 CH 2 OH and HCOOH
After the temperature increase from 125 to 150 K, most of the methanol desorbs. As the ice is mainly made up of methanol, the remaining volatiles trapped in the matrix will desorb as well. The difference in intensity is depicted in Fig. A.4 and is compared to the reference fragmentation patterns of methanol, ethanol, and formic acid. We observe a clear decrease for m/z = 45 and 46, the prominent peaks in the high-mass range of the fragmentation pattern of ethanol (CH3CH2OH). As expected, a decrease in intensity is observed for masses associated with methanol and the methanol clusters (see Fig. 7). A signal decrease at m/z = 47 is tentatively assigned as being due to a small desorbing portion of protonated formic acid. In the low-mass region, m/z = 12 to 18, a clear decrease is observed. Co-desorption of H2O with the methanol matrix explains this.
E (150–175 K): identification of H 2 O, HOCH 2 CHO, CH 3 COOH, and CH 3 OCH 2 OH
In Fig. 8, the fragmentation patterns of water, glycolaldehyde, and acetic acid are compared to the changes in the mass spectra after the temperature increase from 150 to 175 K. The formation of water upon energetic processing of methanol has been observed before (Henderson & Gudipati 2015). Contributions from background deposition can be largely excluded, which has been confirmed by a background experiment. We assign the signal decrease at m/z = 42 and 56, 58, and 60 to the desorption of glycolaldehyde (HOCH2CHO), and the decrease at m/z = 61, 60, 43, and 45 to the desorption of acetic acid (CH3COOH). Reference spectra of acetic acid show the appearance at m/z = 61 assigned to protonated acetic acid (CH3COOH)H+. This mass peak has also been observed in VUV photoionisation studies of acetic acid clusters (Guan et al. 2012). An additional intensity decrease is observed at m/z = 45 and 46, which can be explained by the desorption of the remaining ethanol.
Efforts have been made to confirm the formation of methoxymethanol (CH3OCH2OH), which is expected to thermally desorb around 170 K. In previous studies (Boamah et al. 2014; Maity et al. 2015) a preliminary detection was claimed, following rather restricted literature information on the fragmentation pattern (Johnson & Stanley 1991). The published mass spectrum shows intense peaks at m/z = 29, 30, 31, 33, 45, and 61, but has a low signal at the molecular ion mass, m/z = 62. In the 150−175 K temperature window, we do find a decrease in the dominant peaks consistent with methoxymethanol, indicating that it may be formed. However, we are cautious about this identification, since the published mass spectrum shows only a minor molecular ion peak and it is not possible to measure the full reference fragmentation pattern.
F (175–210 K): identification of (CH 2 OH) 2 and HOCH 2 CHOHCH 2 OH
During the temperature increase from 175 to 210 K, the amount of detected ions further decreases. The intensity decrease in the prominent m/z values is compared to the fragmentation pattern of ethylene glycol and acetic acid in Fig. A.5. The decrease at m/z = 62 indicates that ethylene glycol ((CH2OH)2) has desorbed. Based on the desorption temperatures of the molecules that we take explicitly into account, no decline for other species is expected. However, we do observe an intensity decrease for other masses, indicating that it is likely that more species are present. The observed decrease is in agreement with the fragmentation pattern of acetic acid, which thermally desorbs around 155 K (outside this range).
Since the substrate temperature is 210 K, all ethylene glycol has desorbed from the sample. This is confirmed by the absence of m/z = 62 in the mass spectrum at this temperature. As visible in Fig. 9, the mass spectrum obtained at 210 K still contains clear peaks at m/z = 43, 45, and 61, and traces at 42, 44 and 73, 74, 75. Owing to their high desorption temperature, COMs such as glycerin, glycolic acid, and glyceraldehyde could be the photo-products responsible for this observation. As previously mentioned, it is not possible with the current set-up to measure the fragmentation pattern of species with a negligible vapour pressure, such as glycerin and glycolic acid. Therefore, the interpretation of this mass spectrum has to be guided by the fragmentation standards that are available from the NIST database. Although the relative intensities differ, the fragmentation pattern matches the fragmentation pattern of glycerin (HOCH2CHOHCH2OH). The mass spectrum obtained at 210 K is compared with the fragmentation pattern of glycerin and glycolic acid in Fig. 9. We are unable to determine whether glycolic acid is present since the fragmentation pattern of glycolic acid strongly overlaps with the fragmentation pattern of glycerin, and both species have similar desorption temperatures.
It is important to note that ions at the same m/z values discussed here for very high temperatures are also observed at 20 K after 64 min of VUV irradiation, indicating that these species are also formed at low temperature. This shows that COMs with as many as six carbon/oxygen atoms (i.e. glycerin) form upon VUV photolysis of solid methanol for temperatures typical in dark interstellar clouds.
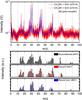 |
Fig. 9 Mass spectrum of ~13.5 nm-thick methanol ice deposited and VUV irradiated at 20 K for 64 min. The sample is heated to 210 K before acquiring the mass spectrum; 70 eV electrons are used as an ionisation source. The experimental results are compared to the NIST fragmentation pattern of glyceraldehyde (HOCH2CHOHCHO), glycerin (HOCH2CHOHCH2OH), and glycolic acid (HOCH2COOH), for clarity plotted on logarithmic scale. |
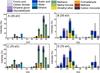 |
Fig. 10 Fit of the different species contributing to the mass spectra obtained after 64 min VUV photolysis of CH3OH at 20 K. The thin bars at different masses represent the integrated area of all individual mass peaks. The mass spectra are fitted simultaneously for two different electron-impact ionisation energies (35 eV, A+B and 70 eV, C+D). The fragmentation patterns of all individual species have been measured in reference experiments; see Table 3 for electron-impact ionisation cross sections. |
G: non-detection of H 2 CCO and HOCH 2 COOH
We have tried to confirm the formation of ketene and/or glycolic acid. Ketene will thermally desorb at 123 K (Maity et al. 2014), but no unambiguous signals have been recorded. In the case of glycolic acid, the NIST database shows a relatively intense m/z = 45 value; unfortunately, this overlaps with the main fragments of glycerin, which desorbs at a similar temperature. Therefore, at this stage no unambiguous identifications can be made.
Electron-impact cross sections of species considered in the fitting routine.
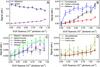 |
Fig. 11 Formation efficiency of COMs as a function of VUV photon fluence. The error bar is based on the standard deviation, determined using eight measurements performed at 32 min of VUV photo-processing. Electron impact ionisation cross sections are taken into account, which allows comparison of the relative yields. |
3.2.2. Fitting library
By fitting low-temperature data it is possible to obtain kinetic growth curves for individual species, which can aid in understanding the photo-chemistry at play. The selection of candidates for the fitting library is based on the experiments performed at elevated temperatures and is listed in Table 3. Since most of these molecules lead to identical fragment ions, this fitting procedure is delicate and the output has to be interpreted with care. It should be noted that not all possible reaction products are included in the fit; it is likely that minor abundances of larger species are missed. Our approach is the following. We start with a selection of the fitting library, based on the species detected in RAIRS studies with a high abundance: ≥1% (Öberg et al. 2009). Depending on the discrepancy between the fit and the data, additional species are selected to obtain a complete fit to all peaks.
Most species contain fragment ions below m/z = 33, while the larger fragment ions are strongly species dependent. By applying different weighting ratios to these m/z regions in the optimisation routine, it is guaranteed that the information provided by higher masses is taken into account appropriately. We increase the weighting of m/z = 43, 58 (glycolaldehyde), and 62 (ethylene glycol). Despite the rather large uncertainties, we have noticed in the fitting procedure anti-correlations between glycolaldehyde/methanol and between dimethyl ether/ethanol. The final fitting library is presented in Table 3 and does not contain acetaldehyde since the amounts detected are negligible. Methoxymethanol has also been excluded. The mass spectrum is first fitted using the library without glycolaldehyde. In a subsequent fit using a library containing glycolaldehyde, the methanol abundance is allowed to vary between 90% and 100%, while no further constraints are applied. Using this approach, the anti-correlation is prevented. Since dimethyl ether and ethanol have been detected using RAIRS (Öberg et al. 2009), their typical formation ratio is known.
3.2.3. Fit
Figure 10 shows the final fit of the mass spectrum of methanol after 64 min of VUV photolysis at 20 K, simultaneously fitted for two electron energies (35 and 70 eV) using Eq. (1). Mass spectra (A, B) were obtained using 35 eV electrons as an ionisation source, while mass spectra (C, D) were obtained using 70 eV electrons. The influence of changing the electron energy is clearly noticeable; 70 eV yields more severe fragmentation. The thin bars at different masses represent the integrated area of all individual mass peaks. Both spectra have been normalised to the mass peak with highest intensity. The different colours show the reference fragmentation pattern of different species and their contribution to the fit.
The final fit obtained is good, although isolated discrepancies exist. The m/z = 61 signal can only have a minor contribution from a cluster ion, so we expect that this discrepancy mainly originates from a photoproduct. One potential candidate is glycerin; the fragmentation pattern (Fig. 9) has a strong fragment ion at m/z = 61.
3.2.4. Kinetics
Figure 11 presents the kinetic growth curve of new species that formed during the VUV photo-processing. The vertical scales are different for the four graphs shown here. As expected, methanol is consumed and leads to the formation of other species. Small species such as formaldehyde, methane, carbon monoxide, carbon dioxide, and water are formed. The amount of water detected is surprisingly high. We performed a reference experiment (no VUV processing) for 4 h and we find that the amount of water deposition from background gas is negligible.
The formation of COMs such as methyl formate, ethylene glycol, dimethyl ether, and ethanol is shown in Fig. 11C. As mentioned in Sect. 3.2.2, there is an anti-correlation when fitting contributions from dimethyl ether and ethanol. This is clearly visible in the graph, where also their combined intensity is depicted. Since these species are distinguishable with infrared spectroscopy (Öberg et al. 2009), the exact formation ratio can be estimated. In Fig. 11D, the growth of glycolaldehyde, acetic acid, and formic acid is shown. Glycolaldehyde is detected, but the error bars are large owing to an increased uncertainty in the fit. Acetic acid and formic acid are better constrained and are clearly formed during the irradiation.
After the fitting procedure we would expect that at zero fluence the signal for all species except methanol should be zero. However, we note that the value relative to glycolaldehyde is different from zero before the photolysis starts. In fact, both methanol and glycolaldehyde have similar fragmentation patterns. In both cases the three most intense peaks are in m/z values of 29, 31, and 32. In the fitting routine we find that in some cases the glycolaldehyde fits part of the methanol mass data. It should be noted that IR spectroscopy suffers from the overlap of vibrational modes for these species and, consequently, it is hard to monitor the kinetics. This validates the efforts of employing different experimental techniques on the same systems.
4. Discussion
4.1. Comparison with previous experiments
As stated in the introduction, the VUV processing of methanol ice has been studied using a variety of detection schemes over the last decades. IR spectroscopy (transmission and RAIRS) have been used in combination with TPD/QMS. This has led to secure detections of small species, such as formaldehyde, carbon monoxide, carbon dioxide, and methane (Gerakines et al. 1996; Baratta et al. 2002; Bennett & Kaiser 2007; Islam et al. 2014). This is in line with the results presented in this paper.
Recent publications (Öberg et al. 2009; Boamah et al. 2014; Maity et al. 2014; Henderson & Gudipati 2015; Mrad et al. 2016) on processing methanol ice using energetic electrons or photons have focused on detecting COMs. Sensitive detection schemes, such as TPD/SPI TOF-MS or two-step laser ablation and ionisation mass spectrometry, as well as TPD/QMS or GC-MS in conjunction with RAIRS have been applied. The detections reported in these studies are listed in Table 1. We did not include the long list of COMs detected in the GC-MS study by Mrad et al. (2016) as here the irradiation time of the methanol ice (3 days) is so much longer than in the present study that a direct comparison is not really possible. Nevertheless, many of their findings are fully in line with the data listed in the last column, which summarises the identifications in the present work. It is clear that COM formation starts with fluences comparable to those expected in the interstellar medium and the high sensitivity of MATRI2CES allows them to be detected at an early stage in their solid state formation path. Many previous detections have now been confirmed with the guarantee that these form at low temperatures, and several tentative new detections have been reported as well. A straightforward comparison with results obtained by Öberg et al. (2009) is possible (Table 1, Col. 1). In that study RAIRS and TPD/QMS are used to study the photo-processing of methanol ice. There is a good overall qualitative agreement with the results presented here, but clearly some quantitative differences exist. In the case of small species such as CO, CO2, and CH4, we obtain different relative abundances because LDPI TOF-MS is less suitable for the quantification of these small species at low temperature than IR spectroscopy. On the contrary, LDPI TOF-MS allows the disentangling of the quantities of COMs that form at low temperature, providing greater insights into the photo-chemistry at play than IR spectroscopy.
The study of Boamah et al. (2014) uses low-energy electrons for processing (Table 1, Col. 2). A large number of COMs are detected, in agreement with the results presented in this paper. There is a qualitative difference for small species (CH4, CO) owing to limitations in substrate temperature in that study.
Maity et al. (2014, 2015) has combined TPD with SPI TOF-MS (Table 1, Col. 3). This has lead to an extended list of COMs. Compared with the present study, some species, such as water, formic acid, and acetic acid, are likely to have formed during the ice processing. If present, these species will not have been detected, since their ionisation potential is higher than the photon energy used for ionisation.
Recently, Henderson & Gudipati (2015) have used two-step laser ablation and ionisation mass spectrometry on VUV and electron (2 keV) processed ices with the aim at detecting newly formed species. Comparing their results with those found here (Table 1, Col. 4), clear differences are found; the VUV experiments result in a higher level of molecular complexity, for which there may be different reasons. It is possible that the ice in the experiment of Henderson & Gudipati (2015) is too thick to be completely processed by the VUV photons. Another explanation is that the actual VUV flux reported in their study provides an upper limit as 1015 photons cm-2 s-1 is on the high side (Ligterink et al. 2015). It is also possible that the use of a UV laser as ionisation source – compared with electron impact that we use here – comes with a different efficiency. In particular the UV laser is expected to be more efficient in the ionisation of aromatic molecules than aliphatic ones.
It should be noted that even though the final products found in many of the studies listed here are comparable, the underlying processes are quite different. Photons with specific energies are expected to favour specific bond cleavage dissociation, whereas impacting electrons will be less selective. On the other hand, the impact of a single high-energy electron can lead to a large number of secondary electrons, initiating a cascade of bond cleavages, forming radicals in the ice, which in turn can lead to the formation of new COMs.
4.2. CH3OH photo-dissocation branching ratio
The formation of COMs depends on the abundance of radicals in the ice and their ability to meet and react. The fitted mass spectra contain information on the abundance of different photo-products. This provides information about the radicals that have successfully found a reaction partner (see chemical network proposed by Öberg et al. 2009). Assuming that only one bond is broken the following radicals can be formed in the ice upon methanol photo-dissociation (Laas et al. 2011): ![\begin{eqnarray} \textrm{CH}_3\textrm{OH} + h\nu & \rightarrow & \textrm{CH}_2\textrm{OH} + \textrm{H} \\[2.5mm] & \rightarrow & \textrm{CH}_3 + \textrm{OH} \\[2.5mm] & \rightarrow & \textrm{O}\textrm{CH}_3 + \textrm{H}. \end{eqnarray}](/articles/aa/full_html/2016/08/aa27937-15/aa27937-15-eq179.png) Since ethanol and dimethyl ether are strongly correlated in the fitting routine, as discussed in Sect. 3.2.3, it is unreliable to directly use their abundance. Instead, we assume their formation ratio is the same as in the RAIRS study (4 ± 2) (Öberg et al. 2009). Without a complete model, it is difficult to accurately determine the photo-dissociation branching ratio of CH3OH. By tracing the abundance of different photoproducts, an estimate of the photo-dissociation branching ratio can be obtained. Based on the chemical network proposed by Öberg et al. (2009), the radicals of interest – hydroxymethyl, methyl, and methoxy – are traced. To form ethylene glycol, two hydroxymethyl radicals are necessary. To form glycolaldehyde, a formyl radical and a hydroxymethyl radical have to react. If we take into account the formation of ethylene glycol, glycolaldehyde, ethanol, methyl formate, and dimethyl ether, we obtain a branching ratio of 5:1 between CH2OH and OCH3. The importance of the CH3+OH branching is constrained by COMs that involve a methyl radical in their formation process. We opt for this approach rather than tracking OH-dependent species, since part of the observed water (an important sink for the OH radical) can be a contaminant. The methyl radical is involved in reactions towards methane, ethanol, and dimethyl ether. The hydroxymethyl and methoxy radical can both absorb another photon, which can lead to the formation of formaldehyde. As a first-order approximation, we assume that the formaldehyde is mainly formed through these two routes and that the formation efficiency for both radicals is the same. Since the CH2OH and OCH3 abundance is 5:1, this indicates that 85% of the formaldehyde is formed from hydroxymethyl radicals and 15% from methoxy radicals. The final deduced branching ratio of methanol photodissociation into CH2OH:CH3+OH:OCH3 amounts to 10:3:2.
Since ethanol and dimethyl ether are strongly correlated in the fitting routine, as discussed in Sect. 3.2.3, it is unreliable to directly use their abundance. Instead, we assume their formation ratio is the same as in the RAIRS study (4 ± 2) (Öberg et al. 2009). Without a complete model, it is difficult to accurately determine the photo-dissociation branching ratio of CH3OH. By tracing the abundance of different photoproducts, an estimate of the photo-dissociation branching ratio can be obtained. Based on the chemical network proposed by Öberg et al. (2009), the radicals of interest – hydroxymethyl, methyl, and methoxy – are traced. To form ethylene glycol, two hydroxymethyl radicals are necessary. To form glycolaldehyde, a formyl radical and a hydroxymethyl radical have to react. If we take into account the formation of ethylene glycol, glycolaldehyde, ethanol, methyl formate, and dimethyl ether, we obtain a branching ratio of 5:1 between CH2OH and OCH3. The importance of the CH3+OH branching is constrained by COMs that involve a methyl radical in their formation process. We opt for this approach rather than tracking OH-dependent species, since part of the observed water (an important sink for the OH radical) can be a contaminant. The methyl radical is involved in reactions towards methane, ethanol, and dimethyl ether. The hydroxymethyl and methoxy radical can both absorb another photon, which can lead to the formation of formaldehyde. As a first-order approximation, we assume that the formaldehyde is mainly formed through these two routes and that the formation efficiency for both radicals is the same. Since the CH2OH and OCH3 abundance is 5:1, this indicates that 85% of the formaldehyde is formed from hydroxymethyl radicals and 15% from methoxy radicals. The final deduced branching ratio of methanol photodissociation into CH2OH:CH3+OH:OCH3 amounts to 10:3:2.
So far in the analysis, the difference in mobility of radicals OCH3, CH3, and CH2OH at 20 K has been neglected. Although diffusion of these radicals through a methanol matrix is difficult to assess, typically the order of the binding energy of the involved species is CH3< OCH3< CH2OH (Garrod et al. 2008; Öberg et al. 2009). This suggests that the CH2OH+H branch may be underestimated and is even more dominant. The dominant branching channel found in this study is in agreement with Öberg et al. (2009). A more prominent CH3 + OH branch is observed in this study, however.
4.3. Glycerin formation mechanism
The reaction between two hydroxymethyl radicals will lead to the formation of ethylene glycol. A subsequent absorption of a VUV photon can result in a dehydrogenation forming for example the HOCHCH2OH radical. If this radical reacts with another hydroxymethyl radical, this leads to the formation of glycerin (Kaiser et al. 2015). It is likely that for other reactions starting from solid ethylene glycol, more species with a complexity comparable to glycerin may form. This depends on local radical abundances and the exact position of the dehydrogenation event in ethylene glycol. One of the interesting species that can form through the recombination of HOCHCH2OH and HCO radicals is glyceraldehyde, a sugar of astrobiological importance. As stated above (Fig. 9), the mass spectrum contains peaks that would be consistent with the formation of this molecule, but given the lower intensity and overlapping features with other species this claim is preliminary. In the study by Mrad et al. (2016) where the long irradiation times result in a large variety of COMs, no proof for glycerin has been found.
5. Astrophysical implications and conclusions
Complex organic molecules have been detected in different environments in the interstellar medium, ranging from cold and hot cores to hot corinos and prestellar cores (Bacmann et al. 2012; Jørgensen et al. 2012; Coutens et al. 2015). With the Atacama Large Millimeter/submillimeter Array (ALMA) and Stratospheric Observatory for Infrared Astronomy (SOFIA) producing data and other facilities that will be online in the near future, it is expected that the number of identified COMs will steadily increase. The exact formation route of these molecules is still under debate, but it is generally accepted that COMs form on icy dust grains following thermal processing, irradiation by VUV light or X-rays, or bombardment by atoms, electrons, and cosmic rays.
One possible starting point is solid methanol formed by the hydrogenation of CO. Methanol is easily fragmented and recombination of the resulting radicals allows the formation of larger species. Indeed, methanol has been observed in the interstellar medium, both in the solid state and in the gas phase, and attempts have been made to link these abundances to those of COMs (Öberg et al. 2014). In the present study the VUV induced photochemistry of pure methanol ice has been studied in the laboratory with the goal of understanding which new molecules form and which processes are involved.
-
Mass spectra obtained at different temperatures combined within situ measured reference fragmentation patterns lead tounambiguous detection of the following species upon VUVphotolysis of pure CH3OH ice at 20 K: Carbon monoxide (CO), methane (CH4), formaldehyde (H2CO), carbon dioxide (CO2), methyl formate (HCOOCH3), acetaldehyde (CH3CHO), dimethyl ether (CH3OCH3), ethanol (CH3CH2OH), water (H2O), acetic acid (CH3COOH), ethylene glycol ((CH2OH)2), formic acid (HCOOH) (tentative), and glycolaldehyde (HOCH2CHO). This is largely in line with Öberg et al. (2009); however, the present method extends the quantification of species that are indistinguishable using IR spectroscopy.
-
Mass spectra obtained at high temperature (210 K) hint at the presence of glycerin (HOCH2CHOHCH2OH). This is the first possible experimental observation of glycerin in VUV processed methanol ice and suggests that molecular complexity in space may be beyond current astronomical detections.
-
A qualitative analysis of the mass spectra obtained at low temperature indicates the detection of fragment ions originating from e.g. (CO)xH
, with x = 3 and y< 3x−1. This is the first detection of such species at low temperature. Large COMs such as (CO)xH, with x = 3 and y< 3x−1, can be formed in the ice layers of interstellar dust grains. -
The study here also provides insight into the methanol branching ratios, at least for the applied experimental conditions. Based on our findings we estimate that the photodissociation branching ratio for methanol ice amounts to CH2OH:CH3+OH:OCH3 = 10:3:2.
The experiments performed can be compared with corresponding processes in the interstellar medium by calculating the integrated energy deposited per methanol molecule. In dark clouds, the amount of energy deposited per water molecule has been estimated by Shen et al. (2004). It ranges from ~1–100 eV per water molecule after 107 yr, depending on the assumed cosmic ray spectrum. Adapting recent measurements of solid state cross section values from Cruz-Diaz et al. (2014) for methanol σ121.6 nm ≈ 8.7 × 10⁻¹⁸ cm2, we calculate that the energy deposited per methanol molecule in a dark cloud is in the range 2.5−500 eV after 107 yr.
Using a similar approach, we can calculate the same quantity for experiments performed in the laboratory using Eqs. (6) and (7):
 where A is the fraction of absorbed photons, σav the average cross section in cm2, N the column density of absorbers in cm-2 determined using the thickness calibration, F the flux in photons cm-2 s-1, Eav the average energy per photon in eV photon-1, and t the time in seconds. Based on the emission profile of the lamp (Fig. 1), we can calculate the average photon energy Eav as 9 eV per photon. In addition, combining the emission profile with the reported methanol cross section (Cruz-Diaz et al. 2014) at multiple wavelengths (121.6, 157.8, and 160.8 nm), we estimate the average cross section (σav) of the methanol molecules to be (3.7 ± 0.4) × 10-18 cm2. These values are inserted into Eq. (7), which calculates the energy deposited per methanol molecule after 64 min of VUV irradiation and is in the range 2.3−4.6 eV per methanol molecule. Compared to the energy deposit per methanol molecule in dark clouds (2.5−500 eV), the energy deposit in the laboratory experiments is at the low limit (Shen et al. 2004; Cruz-Diaz et al. 2014).
For higher fluences it is likely that the accessible complexity will increase further. This links the findings in the present work to the original studies in which long time irradiation of interstellar ice was performed by Bernstein et al. (2002), Muñoz Caro et al. (2002) and Mrad et al. (2016), illustrating the high sensitivity of LDPI TOF-MS as a technique to study COM formation in ice.
Acknowledgments
This work was supported by NOVA, the Netherlands Research School for Astronomy, and a VICI grant from the Netherlands Organisation for Scientific Research (NWO). J.-B.B. is grateful for support from the Marie Sklodowska Curie actions and the Intra-European Fellowship (FP7-PEOPLE-2011-IEF-299258). We thank M. J. A. Witlox for his significant role in the construction of the instrument. The authors thank Gleb Fedoseev and Alan Heays for stimulating discussions.
References
- Bacmann, A., Taquet, V., Faure, A., Kahane, C., & Ceccarelli, C. 2012, A&A, 541, L12 [NASA ADS] [CrossRef] [EDP Sciences] [Google Scholar]
- Baratta, G. A., & Palumbo, M. E. 1998, J. Opt. Soc. Am. A, 15, 3076 [Google Scholar]
- Baratta, G. A., Leto, G., & Palumbo, M. E. 2002, A&A, 384, 343 [NASA ADS] [CrossRef] [EDP Sciences] [Google Scholar]
- Bennett, C. J., & Kaiser, R. I. 2007, ApJ, 661, 899 [NASA ADS] [CrossRef] [Google Scholar]
- Bernstein, M. P., Dworkin, J. P., Sandford, S. A., Cooper, G. W., & Allamandola, L. J. 2002, Nature, 416, 401 [NASA ADS] [CrossRef] [PubMed] [Google Scholar]
- Bhutadia, H., Vinodkumar, M., & Antony, B. 2012, J. Phys. Conf. Ser., 388, 052071 [NASA ADS] [CrossRef] [Google Scholar]
- Boamah, M. D., Sullivan, K. K., Shulenberger, K. E., et al. 2014, Faraday Discuss., 168, 249 [Google Scholar]
- Bolina, A. S., Wolff, A. J., & Brown, W. A. 2005, J. Chem. Phys., 122, 044713 [NASA ADS] [CrossRef] [Google Scholar]
- Boogert, A. C. A., Gerakines, P. A., & Whittet, D. C. B. 2015, ARA&A, 53, 541 [Google Scholar]
- Bossa, J.-B., Paardekooper, D. M., Isokoski, K., & Linnartz, H. 2015, Phys. Chem. Chem. Phys., 17, 17346 [NASA ADS] [CrossRef] [Google Scholar]
- Briggs, R., Ertem, G., Ferris, J. P., et al. 1992, Origins. Life. Evol. B., 22, 287 [Google Scholar]
- Bull, J. N., & Harland, P. W. 2008, Int. J. Mass Spectrom., 273, 53 [Google Scholar]
- Chen, Y.-J., Chuang, K.-J., Muñoz Caro, G. M., et al. 2014, ApJ, 781, 15 [Google Scholar]
- Chuang, K.-J., Fedoseev, G., Ioppolo, S., van Dishoeck, E. F., & Linnartz, H. 2016, MNRAS, 455, 1702 [Google Scholar]
- Coutens, A., Persson, M. V., Jørgensen, J. K., Wampfler, S. F., & Lykke, J. M. 2015, A&A, 576, A5 [NASA ADS] [CrossRef] [EDP Sciences] [Google Scholar]
- Cruz-Diaz, G. A., Muñoz Caro, G. M., Chen, Y.-J., & Yih, T.-S. 2014, A&A, 562, A119 [NASA ADS] [CrossRef] [EDP Sciences] [Google Scholar]
- Cuppen, H. M., Penteado, E. M., Isokoski, K., van der Marel, N., & Linnartz, H. 2011, MNRAS, 417, 2809 [NASA ADS] [CrossRef] [Google Scholar]
- Es-sebbar, E.-t., Bénilan, Y., Fray, N., et al. 2015, ApJS, 218, 19 [NASA ADS] [CrossRef] [Google Scholar]
- Focsa, F., & Destombes, J. 2001, Chem. Phys. Lett., 347, 390 [NASA ADS] [CrossRef] [Google Scholar]
- Fuchs, G. W., Cuppen, H. M., Ioppolo, S., et al. 2009, A&A, 505, 629 [NASA ADS] [CrossRef] [EDP Sciences] [Google Scholar]
- Garrod, R. T., Weaver, S. L. W., & Herbst, E. 2008, ApJ, 682, 283 [NASA ADS] [CrossRef] [Google Scholar]
- Gerakines, P. A., Schutte, W. A., & Ehrenfreund, P. 1996, A&A, 312, 289 [NASA ADS] [Google Scholar]
- Guan, J., Hu, Y., Zou, H., et al. 2012, J. Chem. Phys., 137, 124308 [NASA ADS] [CrossRef] [Google Scholar]
- Hama, T., & Watanabe, N. 2013, Chem. Rev., 113, 8783 [CrossRef] [Google Scholar]
- Henderson, B. L., & Gudipati, M. S. 2015, ApJ, 800, 66 [NASA ADS] [CrossRef] [Google Scholar]
- Hudson, R. L., & Moore, M. H. 2000, Icarus, 145, 661 [NASA ADS] [CrossRef] [Google Scholar]
- Hudson, J. E., Hamilton, M. L., Vallance, C., & Harland, P. W. 2003, Phys. Chem. Chem. Phys., 5, 3162 [CrossRef] [Google Scholar]
- Hudson, J. E., Vallance, C., & Harland, P. W. 2004, J. Phys. B, 37, 445 [Google Scholar]
- Hudson, R. L., Moore, M. H., & Cook, A. M. 2005, Adv. Space Res., 36, 184 [NASA ADS] [CrossRef] [Google Scholar]
- Hudson, J. E., Weng, Z. F., Vallance, C., & Harland, P. W. 2006, Int. J. Mass Spectrom., 248, 42 [NASA ADS] [CrossRef] [Google Scholar]
- Islam, F., Baratta, G. A., & Palumbo, M. E. 2014, A&A, 561, A73 [NASA ADS] [CrossRef] [EDP Sciences] [Google Scholar]
- Isokoski, K., Bossa, J.-B., Triemstra, T., & Linnartz, H. 2014, Phys. Chem. Chem. Phys., 16, 3456 [NASA ADS] [CrossRef] [Google Scholar]
- Johnson, R. A., & Stanley, A. E. 1991, Appl. Spectrosc., 45, 218 [NASA ADS] [CrossRef] [Google Scholar]
- Jørgensen, J. K., Favre, C., Bisschop, S. E., et al. 2012, ApJ, 757, L4 [NASA ADS] [CrossRef] [Google Scholar]
- Kaiser, R. I., Maity, S., & Jones, B. M. 2015, Angew. Chem., 127, 197 [CrossRef] [Google Scholar]
- Kim, Y.-K., & Rudd, M. E. 1994, Phys. Rev. A, 50, 3954 [NASA ADS] [CrossRef] [PubMed] [Google Scholar]
- Kim, Y.-K., Hwang, W., Weinberger, N., Ali, M., & Rudd, M. 1997, J. Chem. Phys., 106, 1026 [NASA ADS] [CrossRef] [Google Scholar]
- Laas, J. C., Garrod, R. T., Herbst, E., & Widicus Weaver, S. L. 2011, ApJ, 728, 71 [NASA ADS] [CrossRef] [Google Scholar]
- Lagarias, J., Reeds, J., Wright, M., & Wright, P. 1998, SIAM. J. Optim., 9, 112 [Google Scholar]
- Ligterink, N. F. W., Paardekooper, D. M., Chuang, K.-J., et al. 2015, A&A, 584, A56 [NASA ADS] [CrossRef] [EDP Sciences] [Google Scholar]
- Linnartz, H., Ioppolo, S., & Fedoseev, G. 2015, Int. Rev. Phys. Chem., 34, 205 [CrossRef] [Google Scholar]
- Maity, S., Kaiser, R. I., & Jones, B. M. 2014, Faraday Discuss., 168, 485 [Google Scholar]
- Maity, S., Kaiser, R. I., & Jones, B. M. 2015, Phys. Chem. Chem. Phys., 17, 3081 [CrossRef] [Google Scholar]
- Moore, M. H., & Hudson, R. L. 2005, in Astrochemistry: Recent Successes and Current Challenges, eds. D. C. Lis, G. A. Blake, & E. Herbst, IAU Symp., 231, 247 [Google Scholar]
- Mrad, N. A., Duvernay, F., Chiavassa, T., & Danger, G. 2016, MNRAS, DOI: 10.1093/mnras/stw346 [Google Scholar]
- Muñoz Caro, G. M., Meierhenrich, U. J., Schutte, W. A., et al. 2002, Nature, 416, 403 [NASA ADS] [CrossRef] [PubMed] [Google Scholar]
- Öberg, K. I., Garrod, R. T., van Dishoeck, E. F., & Linnartz, H. 2009, A&A, 504, 891 [NASA ADS] [CrossRef] [EDP Sciences] [Google Scholar]
- Öberg, K. I., Lauck, T., & Graninger, D. 2014, ApJ, 788, 68 [NASA ADS] [CrossRef] [Google Scholar]
- Paardekooper, D. M., Bossa, J.-B., Isokoski, K., & Linnartz, H. 2014, Rev. Sci. Instrum., 85, 104501 [Google Scholar]
- Schwarz-Selinger, T., Preuss, R., Dose, V., & von der Linden, W. 2001, J. Mass Spectrom., 36, 866 [CrossRef] [Google Scholar]
- Shen, C. J., Greenberg, J. M., Schutte, W. A., & van Dishoeck, E. F. 2004, A&A, 415, 203 [NASA ADS] [CrossRef] [EDP Sciences] [Google Scholar]
- Sugohara, R. T., Homem, M. G. P., Iga, I., et al. 2013, Phys. Rev. A, 88, 022709 [NASA ADS] [CrossRef] [Google Scholar]
- van Dishoeck, E. F. 2014, Faraday Discuss., 168, 9 [NASA ADS] [CrossRef] [PubMed] [Google Scholar]
- Watanabe, N., & Kouchi, A. 2002, ApJ, 571, L173 [NASA ADS] [CrossRef] [Google Scholar]
- Weast, R. 1972, Handbook of Chemistry and Physics 53rd edn. (Chemical Rubber Pub.), 207 [Google Scholar]
Appendix A: Additional figures
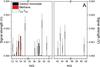 |
Fig. A.1 Ion mass fragmentation signals (black and red filled boxes) and integrated mass difference signal (open boxes) for T = 20 and 50 K are shown for the m/z peaks that correspond to ion fragment masses of carbon monoxide and methane for 70 eV electron impact. The derived uncertainty level is indicated for each difference signal. |
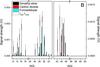 |
Fig. A.2 Ion mass fragmentation signals (black, red, and cyan filled boxes) and integrated mass difference signal (open boxes) for T = 50 and 100 K are shown for the m/z peaks that correspond to ion fragment masses of dimethyl ether, carbon dioxide, and formaldehyde for 70 eV electron impact. The derived uncertainty level is indicated for each difference signal. |
 |
Fig. A.3 Ion mass fragmentation signals (black, red, and magenta filled boxes) and integrated mass difference signal (open boxes) for T = 100 and 125 K are shown for the m/z peaks that correspond to ion fragment masses of methyl formate, dimethyl ether, and acetaldehyde for 70 eV electron impact. The derived uncertainty level is indicated for each difference signal. |
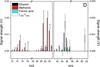 |
Fig. A.4 Ion mass fragmentation signals (black, red, and cyan filled boxes) and integrated mass difference signal (open boxes) for T = 125 and 150 K are shown for the m/z peaks that correspond to ion fragment masses of ethanol, methanol, and formic acid for 70 eV electron impact. The derived uncertainty level is indicated for each difference signal. |
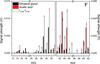 |
Fig. A.5 Ion mass fragmentation signals (black and red filled boxes) and integrated mass difference signal (open boxes) for T = 175 and 210 K are shown for the m/z peaks that correspond to ion fragment masses of ethylene glycol and acetic acid for 70 eV electron impact. The derived uncertainty level is indicated for each difference signal. |
All Tables
Overview of recent studies focusing on energetically processing methanol ice using a variety of detection techniques.
Properties and sample purities of potential photoproducts of VUV-irradiated methanol ice.
All Figures
|
Fig. 1 Spectral energy distribution of the VUV lamp (116–170 nm) described in the text (Ligterink et al. 2015). |
| In the text | |
|
Fig. 2 Reference mass spectra of ~13.5 nm-thick CH3OH ice deposited at 20 K, using 35 eV (red) and 70 eV (blue) electrons as an ionisation source. |
| In the text | |
|
Fig. 3 Mass spectra of ~13.5 nm-thick methanol ice deposited at 20 K, using 70 eV electrons as an ionisation source at different VUV fluences. The VUV fluence is plotted on a log scale; for clarity the reference spectrum is presented at the origin. |
| In the text | |
|
Fig. 4 Intensity ratio of low to high laser pulse energy. A 2σ-error bar is shown. |
| In the text | |
|
Fig. 5 Mass spectrum of ~13.5 nm-thick methanol ice deposited at 20 K, photo-processed for 128 min corresponding with a fluence of (2.3 ± 0.8) × 1017 photons cm-2 using 70 eV electrons as an ionisation source. |
| In the text | |
|
Fig. 6 Mass spectrum of ~13.5 nm-thick methanol ice (CH3OH and 13CH3OH) deposited at 20 K, using 70 eV electrons as an ionisation source, irradiated for 64 min and corresponding fluence: (1.2 ± 0.4) × 1017 photons cm-2. The inset depicts the correlation of the peak intensities between the two experiments,i.e. 12CHy vs. 13CHy. |
| In the text | |
|
Fig. 7 Overview of the mass spectra of VUV processed methanol ice acquired at different temperatures, using 70 eV electrons as an ionisation source. The fluence level is noted in brackets. Low fluence corresponds to (1.2 ± 0.4) × 1017 photons cm-2 and high fluence to (5 ± 2) × 1017 photons cm-2 (estimated). The high-fluence experiment follows a different experimental procedure: simultaneous deposition (~240 ML) and photolysis (4 h). |
| In the text | |
|
Fig. 8 Ion mass fragmentation signals (black, red, and blue filled boxes) and integrated mass difference signal (open boxes) for T = 150 and 175 K are shown for the m/z peaks that correspond to ion fragment masses of water, glycolaldehyde, and acetic acid for 70 eV electron impact. The derived uncertainty level is indicated for each difference signal. |
| In the text | |
|
Fig. 9 Mass spectrum of ~13.5 nm-thick methanol ice deposited and VUV irradiated at 20 K for 64 min. The sample is heated to 210 K before acquiring the mass spectrum; 70 eV electrons are used as an ionisation source. The experimental results are compared to the NIST fragmentation pattern of glyceraldehyde (HOCH2CHOHCHO), glycerin (HOCH2CHOHCH2OH), and glycolic acid (HOCH2COOH), for clarity plotted on logarithmic scale. |
| In the text | |
|
Fig. 10 Fit of the different species contributing to the mass spectra obtained after 64 min VUV photolysis of CH3OH at 20 K. The thin bars at different masses represent the integrated area of all individual mass peaks. The mass spectra are fitted simultaneously for two different electron-impact ionisation energies (35 eV, A+B and 70 eV, C+D). The fragmentation patterns of all individual species have been measured in reference experiments; see Table 3 for electron-impact ionisation cross sections. |
| In the text | |
|
Fig. 11 Formation efficiency of COMs as a function of VUV photon fluence. The error bar is based on the standard deviation, determined using eight measurements performed at 32 min of VUV photo-processing. Electron impact ionisation cross sections are taken into account, which allows comparison of the relative yields. |
| In the text | |
|
Fig. A.1 Ion mass fragmentation signals (black and red filled boxes) and integrated mass difference signal (open boxes) for T = 20 and 50 K are shown for the m/z peaks that correspond to ion fragment masses of carbon monoxide and methane for 70 eV electron impact. The derived uncertainty level is indicated for each difference signal. |
| In the text | |
|
Fig. A.2 Ion mass fragmentation signals (black, red, and cyan filled boxes) and integrated mass difference signal (open boxes) for T = 50 and 100 K are shown for the m/z peaks that correspond to ion fragment masses of dimethyl ether, carbon dioxide, and formaldehyde for 70 eV electron impact. The derived uncertainty level is indicated for each difference signal. |
| In the text | |
|
Fig. A.3 Ion mass fragmentation signals (black, red, and magenta filled boxes) and integrated mass difference signal (open boxes) for T = 100 and 125 K are shown for the m/z peaks that correspond to ion fragment masses of methyl formate, dimethyl ether, and acetaldehyde for 70 eV electron impact. The derived uncertainty level is indicated for each difference signal. |
| In the text | |
|
Fig. A.4 Ion mass fragmentation signals (black, red, and cyan filled boxes) and integrated mass difference signal (open boxes) for T = 125 and 150 K are shown for the m/z peaks that correspond to ion fragment masses of ethanol, methanol, and formic acid for 70 eV electron impact. The derived uncertainty level is indicated for each difference signal. |
| In the text | |
|
Fig. A.5 Ion mass fragmentation signals (black and red filled boxes) and integrated mass difference signal (open boxes) for T = 175 and 210 K are shown for the m/z peaks that correspond to ion fragment masses of ethylene glycol and acetic acid for 70 eV electron impact. The derived uncertainty level is indicated for each difference signal. |
| In the text | |
Current usage metrics show cumulative count of Article Views (full-text article views including HTML views, PDF and ePub downloads, according to the available data) and Abstracts Views on Vision4Press platform.
Data correspond to usage on the plateform after 2015. The current usage metrics is available 48-96 hours after online publication and is updated daily on week days.
Initial download of the metrics may take a while.