Fig. A.4
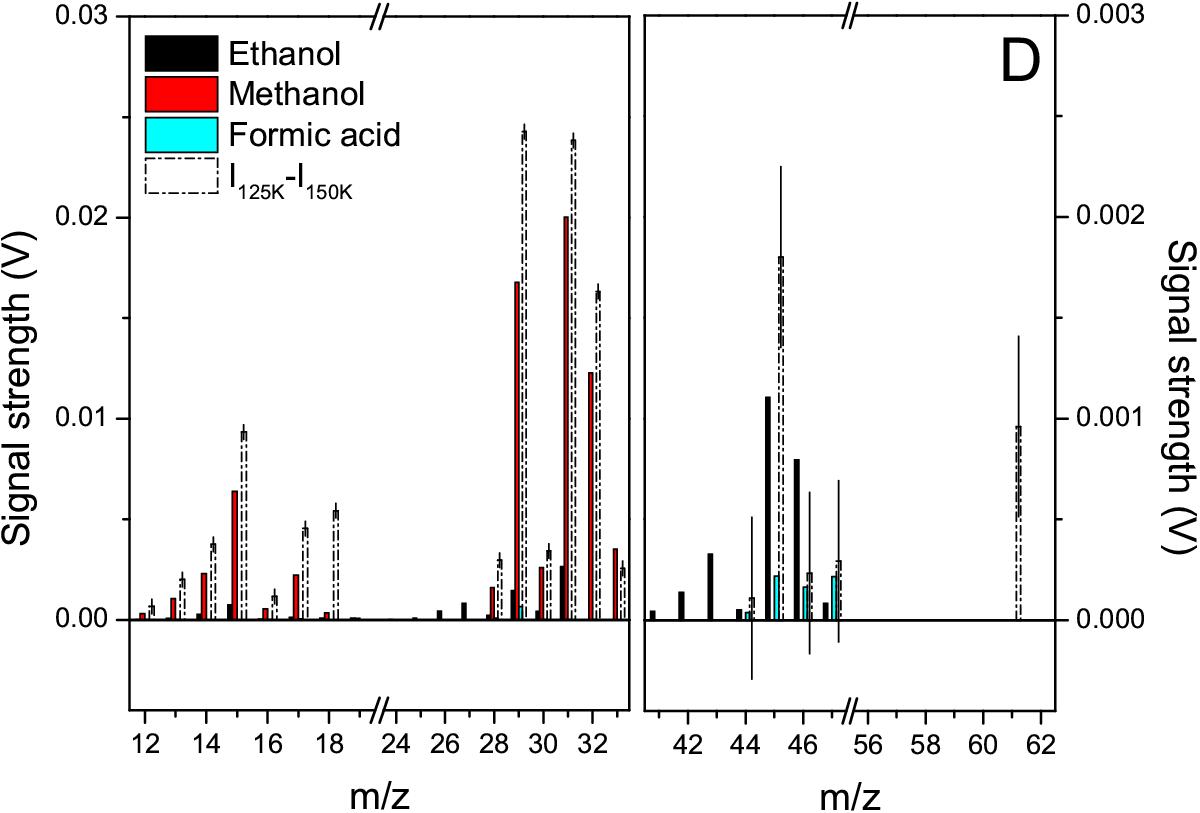
Ion mass fragmentation signals (black, red, and cyan filled boxes) and integrated mass difference signal (open boxes) for T = 125 and 150 K are shown for the m/z peaks that correspond to ion fragment masses of ethanol, methanol, and formic acid for 70 eV electron impact. The derived uncertainty level is indicated for each difference signal.
Current usage metrics show cumulative count of Article Views (full-text article views including HTML views, PDF and ePub downloads, according to the available data) and Abstracts Views on Vision4Press platform.
Data correspond to usage on the plateform after 2015. The current usage metrics is available 48-96 hours after online publication and is updated daily on week days.
Initial download of the metrics may take a while.