Fig. 10
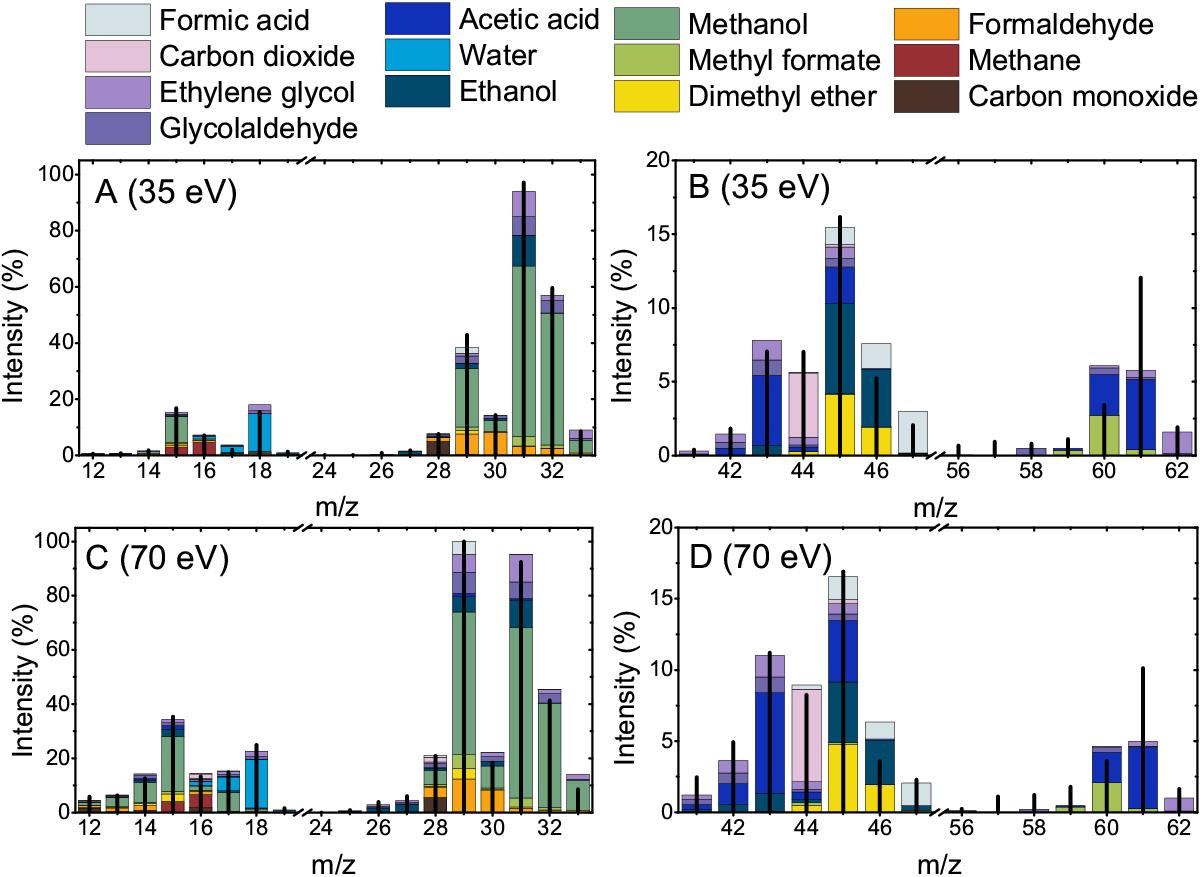
Fit of the different species contributing to the mass spectra obtained after 64 min VUV photolysis of CH3OH at 20 K. The thin bars at different masses represent the integrated area of all individual mass peaks. The mass spectra are fitted simultaneously for two different electron-impact ionisation energies (35 eV, A+B and 70 eV, C+D). The fragmentation patterns of all individual species have been measured in reference experiments; see Table 3 for electron-impact ionisation cross sections.
Current usage metrics show cumulative count of Article Views (full-text article views including HTML views, PDF and ePub downloads, according to the available data) and Abstracts Views on Vision4Press platform.
Data correspond to usage on the plateform after 2015. The current usage metrics is available 48-96 hours after online publication and is updated daily on week days.
Initial download of the metrics may take a while.