| Issue |
A&A
Volume 591, July 2016
|
|
|---|---|---|
| Article Number | A71 | |
| Number of page(s) | 12 | |
| Section | Galactic structure, stellar clusters and populations | |
| DOI | https://doi.org/10.1051/0004-6361/201628465 | |
| Published online | 17 June 2016 | |
Embedded star clusters as sources of high-energy cosmic rays
Modelling and constraints
1 Laboratoire d’Annecy-le-Vieux de Physique des Particules, Université Savoie Mont-Blanc, CNRS/IN2P3, 74941 Annecy-le-Vieux, France
e-mail: gilles.maurin@lapp.in2p3.fr
2 Laboratoire Univers et Particules de Montpellier, Université Montpellier 2, CNRS/IN2P3, CC 72, Place Eugène Bataillon, 34095 Montpellier Cedex 5, France
3 School of Physics, University of the Witwatersrand, 1 Jan Smuts Avenue, Braamfontein, 2050 Johannesburg, South Africa
Received: 9 March 2016
Accepted: 4 May 2016
Context. Massive stars are mainly found in stellar associations. These massive star clusters occur in the heart of giant molecular clouds. The strong stellar wind activity in these objects generates large bubbles and induces collective effects that could accelerate particles up to high energy and produce γ-rays. The best way to input an acceleration origin to the stellar wind interaction in massive stellar cluster is to observe young massive star clusters in which no supernova explosion has occurred yet.
Aims. This work aims to constrain the part of stellar wind mechanical energy that is converted into energetic particles using the sensitivity of the ongoing Fermi-LAT instrument. This work further provides detailed predictions of expected γ-ray fluxes in the view of the on-set of the next generation of imaging atmospheric Cherenkov telescopes.
Methods. A one-zone model where energetic particles are accelerated by repeated interactions with strong supersonic shocks occurring in massive star clusters was developed. The particle escape from the star cluster and subsequent interaction with the surrounding dense material and magnetic fields of the HII region was computed. We applied this model to a selection of eight embedded star clusters constricted by existing observations. We evaluated the γ-ray signal from each object, combining both leptonic and hadronic contributions. We searched for these emissions in the Fermi-LAT observations in the energy range from 3 to 300 GeV and compared them to the sensitivity of the Cherenkov Telescope Array (CTA).
Results. No significant γ-ray emission from these star clusters has been found. Less than 10% of stellar wind luminosities are supplied to the relativistic particles. Some clusters even show acceleration efficiency of less than 1%. The CTA would be able to detect γ-ray emission from several clusters in the case of an acceleration efficiency of close to one percent.
Key words: acceleration of particles / astroparticle physics / radiation mechanisms: non-thermal / stars: massive / gamma rays: general / HII regions
© ESO, 2016
1. Introduction
The shells of supernova remnants (SNRs) are considered to be the main acceleration sites of galactic cosmic rays (GCRs; see e.g. Drury et al. 2001). The detection of radio synchrotron radiation from SNR shells has already proved that electrons with relativistic energies are accelerated in these objects. Recent X-ray synchrotron emission observed in several historical SNRs have been shown to result from the acceleration of electrons up to TeV energies in a magnetic field amplified by two orders of magnitude with respect to standard interstellar values (Parizot et al. 2006). The magnetic field amplification is likely caused by the acceleration of protons and heavier ions (Bell & Lucek 2001). Even if a definite proof of a leptonic or hadronic origin of the γ-ray emission does not exist yet, the presence of TeV photons detected from these shells (for a review of TeV-detected SNRs see e.g. Komin et al. 2011) further supports the hypothesis that SNRs are sources of GCRs. This emission can be interpreted either as inverse Compton (IC) upscattering of low-energy photons by the relativistic electrons or as a product of decaying pions produced by hadronic interactions of CRs with the ambient shocked material.
Other potential sources of energetic particles (to become CRs) exist, however, and at this stage still cannot be excluded (see again Drury et al. 2001). Similarly to SNRs, CRs can also be accelerated in the shells of superbubbles. The superbubbles are blown into the interstellar medium by the combined effects of stellar winds produced by associations of massive stars and successive supernova explosions. So far, GeV and TeV γ-ray emissions have been detected in a few superbubbles; for instance, the Fermi-LAT instrument has detected GeV radiation from Cygnus OB2 in the Milky Way (Ackermann et al. 2011) and the HESS Cherenkov telescope has detected a signal from 30 Dor C in the Large Magellanic Cloud (Abramowski et al. 2015) and from Westerlund 1 (Abramowski et al. 2012) in the Milky Way. This γ-ray emission is evidence that particle acceleration is ongoing in these objects. Although in the cases cited above several supernova explosions have likely occurred and it is possible that embedded SNRs are responsible for (or contribute to) particle acceleration in these objects (Bykov et al. 2013; Ferrand & Marcowith 2010; Butt 2010; Ferrand et al. 2008).
Most of the massive stars are born, live, and die in clusters. Rich and dense populations of massive stars can in fact be found in massive star clusters (MSC), which host strong supersonic winds with velocities ~1000 km s-1 or even beyond. These winds can interact each other directly (Parizot et al. 2004). The mechanical energy imparted in the winds of the most massive stars (≥O4-type) over their lifetime is equivalent to the mechanical energy deposited by a supernova explosion. Hence, if as stated above, SNRs are among the possible sites of cosmic particle acceleration; direct interactions of massive stellar winds in a cluster can also drive particle acceleration (Bykov 2001). In that view, the recent detection of γ-ray emission from Eta Carina by the Fermi collaboration (Abdo et al. 2010) modulated by its orbital period (Reitberger et al. 2015) suggests that wind-wind interaction in these systems can accelerate particles up to high energies. In this work it is assumed, following the model of Klepach et al. (2000), that energetic particles are accelerated in MSC owing to collective acceleration produced by multiple shock encounters. The contribution of massive stars to the production of energetic particles is tested. To that aim, a simple one-zone model is developed, in which γ-ray radiations are produced by relativistic particles accelerated in a MSC interacting with the matter concentrated in the dense surrounding HII region. This model is different from the approach of Domingo-Santamaría & Torres (2006) and Torres et al. (2004), where γ-ray radiations are produced in the MSC. From different catalogues a list of young MSCs, where no supernova has occurred yet, was selected. As a result of their high density, the radiation produced by the HII regions is significantly higher and much better constrained than in MSCs. One should keep in mind that the one-zone model considered here is conservative as each MSC could also contribute to the global γ-ray emission. This model is similar and complementary to the work of Bednarek (2007). For different sets of sources, constraints on the conversion parameter of the wind power into energetic particles using the Fermi-LAT observations in the energy range from 3 to 300 GeV are obtained. This work also provides detailed predictions of expected γ-ray fluxes for the future Cherenkov Telescope Array (CTA). The reliability of the results is finally discussed with respect to CR transport models in HII regions. The γ-ray emission from young star clusters and stellar-wind bubbles (SWBs) would be the best evidence for particle acceleration originated by stellar wind interactions. The article is organized as follows. In Sect. 2 the model of particle acceleration in embedded star clusters is presented. Section 3 details the electron and proton spectra as well as the γ-ray emission obtained from the model. The selection of the MSC sample, the physical parameters of the MSCs, and the search for γ-ray emission are discussed in Sect. 4. Section 5 discusses different tests of the model with respect to the MSC sample data and Sect. 6 is a discussion of the efficiency of particle acceleration in young MSCs. The conclusions and some perspectives are outlined in Sect. 7.
2. Particle acceleration model
The main hypothesis of this model is to assume that a fraction ξ of the total stellar wind luminosity Lw released by the central cluster is converted into energetic particle power Pp. Namely, for protons and electrons, respectively, a specific fraction is introduced:
-
For protons: Pp = ξpLw.
-
For electrons: Pe = ξeLw = KepξpLw, where Kep is the electron-to-proton ratio.
The Lw is assumed to be constant as function of the time and is the sum of the contribution of massive stars contained in the cluster. The model has two main regions, which are shown in Fig. 1. The interstellar bubble is the central region containing the massive star cluster where particles are accelerated by collective shock acceleration, and the HII region is the second region engulfing the stellar cluster that contains most of the mass of the system and hence the target material for energetic particles escaping the central cluster. For simplicity, a spherical geometry is assumed in this model.
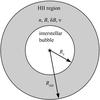 |
Fig. 1 Spherical model of a star cluster embedded in a HII region. The interstellar bubble (or region 1) has a radius Rb. The HII region (or region 2) has an outer radius of RHII and is characterized by the density n, magnetic field strength B, intensity of the magnetic turbulence level δB, and index of turbulence ν. The interstellar bubble is much smaller than the HII region, Rb ≪ RHII. |
The interstellar bubble corresponds to the region of the stellar wind in Weaver et al. (1977); it should account for both unshocked and shocked stellar wind regions. The HII region includes the shocked interstellar gas and the stellar-ionized interstellar gas (Freyer et al. 2003). The size of the interstellar bubble, Rb, is identified with the stellar wind termination shock radius in Weaver et al. (1977) because it is difficult to derive the shocked stellar region observationally. The RHII corresponds to the radius of the ionizing front of the HII region associated with the cluster, and it is dependent of the cluster age (see an estimation given by Eq. (1) in Freyer et al. 2003). Owing to the radiative luminosity of the cluster, the size of the bubble is negligible compared to the size of the HII region although this is not always the case in reality. This implies that the HII region is the main emission region.
As detailed by Aharonian & Atoyan (2000), a one-zone approximation to describe the particle spectrum in the HII region is used, 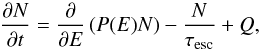 (1)where N is the energy density of the particles, P(E) is the volume-averaged energy loss rate of the particles, Q ≡ Q(E,t) is the source term due to the acceleration process occurring in the interstellar bubble and τesc ≡ τesc(E) is the escape time, which is the characteristic time needed for energetic particles to escape from the HII region.
2.1. Particle injection from the interstellar bubble
The source term Q(E,t) is linked with the energetic particle power by 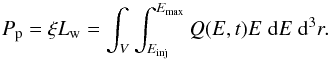 (2)Assuming a power-law injection spectrum, Q(E) = Q0E− s, with an injection index typically chosen to be s = 2, this yields
 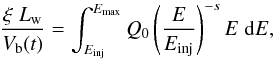 (3)where Einj is the injection kinetic energy of particles in the acceleration process and Emax the maximum energy reached by particles by the collective acceleration process occurring in the cluster. The injection energy is fixed at
  ; it corresponds to an injection momentum of mpc, where mp is the proton mass and c is the speed of light.
It is not the purpose of this simple approach to model the particle acceleration in the cluster., however, we briefly discuss the expected values of Emax for protons and electrons below. Our estimations follow the wind models developed by Klepach et al. (2000, their model I and model II). The particles are accelerated by repeated shock acceleration associated with multiple interactions with wind termination shocks. If the shock filling factor is f = 1 then strong turbulence produced by shock-shock interaction controls the particle acceleration and transport (see e.g. Bykov 2001; Parizot et al. 2004). Multiple shock acceleration produces Emax values that are higher than what is expected in isolated massive stars (see e.g. Voelk & Forman 1982). In case the shock filling factor is f< 1 then the collective wind acceleration timescale is tacc = aRw/ (3Uwf), where Rw and Uw are the termination shock radius and asymptotic velocity, respectively, and a = 3r/ (r−1) is controlled by the shock compression ratio r (assumed to be 4 in this work). Klepach et al. (2000) obtained maximum proton energies of Emax,p ~ 2 /ηD PeV, where ηD = Di/DB is the ratio of the Bohm diffusion coefficient to the diffusion coefficient in the winds. We consider the possibility of having a diffusion that is close to Bohm diffusion and a value of Emax in range 1−10 PeV is adopted. If strong turbulence is generated in the MSC (Bykov 2001), maximum proton energies may reach 100 PeV. The value Emax is high enough to test possible γ-ray emission from massive star clusters. The electron maximum energy in the cluster is fixed by balancing the collective wind acceleration timescale with the synchrotron loss time. Accounting for uncertainties for Uw and Rw typical values of Ee,max = 10−100 TeV are obtained for a MSC magnetic field strength BMSC = 10−100 μG (Parizot et al. 2004). The maximum energy Emax usually has only a weak influence on the results (see the discussion in Sect. 6.1).
Further on a homogeneous particle distribution is assumed, hence, the integral on the volume can be replaced by the volume of the bubble Vb. The bubble volume evolves with time. Following Weaver et al. (1977), the size of the bubble increases as Rb ∝ t2/5. Hence Q0 is also a function of the time and evolves as Q0 ∝ t− 6/5; i.e. more particles are injected at earlier times.
2.2. Escape from the HII region
In the case of a three-dimensional (3D) isotropic diffusion process, the escape time can be written as  (4)where RHII is the HII region radius, assumed to be constant in this work, and D(E) the spatial diffusion coefficient inside the HII region. The spatial diffusion coefficient is supposed to be proportional to the local galactic diffusion coefficient D0. We fix the value at 3 GeV to D0,3 GeV ≈ 4 × 1028 cm-1 s-1, which is deduced from B/C ratio measurements in cosmic ray data (see Ptuskin et al. 2006),
  (5)The coefficient is fixed by two parameters: the ratio D/D0 and the index of turbulence ν. We adopt a turbulence index of ν = 5/3 in the case of a Kolmogorov turbulence or ν = 3/2 for the Iroshnikov-Kraichnan turbulence. Following Marcowith & Casse (2010), the ratio D/D0 can be derived from
  (6)to be
 ![\begin{equation} D/D_0 = \left\{ \begin{array}{l l} \frac{D}{D_0}= \frac{1.2 \times 10^{-3}}{\eta} \times \left (\frac{\ell_{\rm c,pc}}{B_{10}} \right )^{1/2} \quad \rm{if} \; \nu = 3/2 \\[3mm] \frac{D}{D_0}= \frac{1.2 \times 10^{-2}}{\eta} \times \ell_{\rm c,pc}^{2/3} \; B_{10}^{-1/3} \quad \rm{if} \; \nu = 5/3. \end{array} \right . \end{equation}](/articles/aa/full_html/2016/07/aa28465-16/aa28465-16-eq59.png) (7)The following notations are used:
(7)The following notations are used: ![\hbox{$\eta= \delta B^2/(\delta B^2 + B_0^2) \in [0,1]$}](/articles/aa/full_html/2016/07/aa28465-16/aa28465-16-eq60.png) is the turbulence level, δB is the intensity of the magnetic turbulence level and B0 the mean intensity of the magnetic field, lc the coherence length of the turbulent magnetic field, here fixed at 1 pc (for details see Giacinti et al. 2014). Hereafter, two cases are studied: δB = 0.1B0, for low magnetic turbulence level, and δB = B0, for a strongly turbulent case. B10 is the mean magnetic field strength in units of 10 μG, B10 = B0/ 10 μG.
is the turbulence level, δB is the intensity of the magnetic turbulence level and B0 the mean intensity of the magnetic field, lc the coherence length of the turbulent magnetic field, here fixed at 1 pc (for details see Giacinti et al. 2014). Hereafter, two cases are studied: δB = 0.1B0, for low magnetic turbulence level, and δB = B0, for a strongly turbulent case. B10 is the mean magnetic field strength in units of 10 μG, B10 = B0/ 10 μG.
2.3. Cooling in the HII region
As particles enter the HII region, they suffer energy losses through several processes. For protons, the dominant loss process is pion production. Adiabatic losses do not play a role as the HII region has an approximate stationary size with respect to the escape timescale of the energetic particles, and the Coulomb interaction and ionization losses are negligible at the energies under consideration. For electrons, the following loss processes are considered: i) synchrotron losses that depend on the magnetic field in the HII region; ii) Bremsstrahlung losses that depend on the density of the HII region; and iii) inverse Compton losses using various photon fields: cosmic microwave background (CMB), Galactic photon field and the light from the cluster itself is added. This light is just a sum of black bodies from each O star of the stellar cluster. The content of O stars in the stellar cluster is known from the Galactic O-Star Catalog (see the Sect. 4.1 for the details of the cluster selection from this catalogue).
2.4. Solution of the one-zone model
According to Aharonian & Atoyan (2000), the energetic particle spectrum in the HII region is given by the following analytical solution of the one-zone Eq. (1): 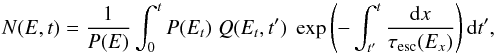 (8)where Et is the energy of a particle at an instant t′<t with an energy E at an instant t given by
 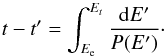 (9)
(9)
2.5. Summary of the modelling procedure
The model depends on several parameters that are generally fixed or constrained by observations: i) the age and distance from Earth are fixed by optical and/or infrared (IR) observations; ii) the radius RHII and density nHII of the HII region are fixed by optical observations and can be compared with the solutions outlined in Freyer et al. (2003); iii) the stellar wind luminosity Lw is obtained from the stellar content in the cluster; and iv) the size of the interstellar bubble is deduced from optical observations and can be compared with the solutions outlined by Weaver et al. (1977).
Free parameters and their limits are: i) the conversion efficiency ξ with ξ< 1; ii) the electron-to-proton ratio Kep for which the range [ 10-4,10-2 ] can be reasonably used; the magnetic field in the HII region that is at least equal to the mean Galactic field of 3 μG and could hardly be higher than 100 μG (Harvey-Smith et al. 2011); iii) the magnetic field turbulence level of 0.1 <δB/B< 1; iv) the index of turbulence of ν = 5/3 or 3/2; v) the index of the injection spectrum is conservatively fixed to s = 2; and vi) the coherence length of the turbulent magnetic field is fixed to lc = 1 pc.
3. Particle and photon spectra
In this chapter the one-zone model presented in Sect. 2 is applied to a generic star cluster to understand the typical behaviour of star clusters. This generic cluster is 1 Myr old, contains one O3-type star, and is located in a HII region with a radius of RHII = 10 pc and densities of nHII = 10 cm-3, representing a low-density scenario, or nHII = 1000 cm-3, representing a high-density scenario. The electron and proton spectra and the subsequent γ-ray spectra are calculated.
3.1. Electrons
3.1.1. Characteristic times
As the electrons enter the HII region, they suffer energy losses through several processes: IC scattering off the CMB, galactic photon fields, and star light from the cluster itself; synchrotron radiation in the magnetic field B in the HII region; and finally Bremsstrahlung depending on the density nHII inside the HII region.
The characteristic times of these processes are computed according to Blumenthal & Gould (1970) and are shown in Fig. 2. They are compared to the escape times (Eq. (4)) for different values for the density, index of turbulence, and intensity and turbulence of the magnetic field. A physical process dominates if its characteristic time is the shortest.
In the low-density scenario, all processes are largely dominated by escape losses with the exception of the synchrotron emission in a high magnetic field, however, a high magnetic field is only expected at high densities (Harvey-Smith et al. 2011). In the high-density scenario the escape in the case of a magnetic field with a low level of turbulence is still dominant. Electro-magnetic losses only become significant or dominant in the case of high density and high level of magnetic turbulence: Bremsstrahlung losses become dominant at lower energies; synchrotron losses become significant or dominant in a high magnetic field at higher energies.
Low-energy electrons undergo IC scattering off the CMB and off star light from the cluster itself, but the Klein-Nishina effect becomes important for IC scattering off stellar radiation at high energy (E> 100 GeV). The electrons scatter mainly on CMB. IC is still negligible when confronted with other processes.
These results call for two remarks. First, escapes dominate the other processes in most of the cases. Second, at high energies the characteristic times of the dominant processes are well below the age of the cluster. These validate the assumption of a one-zone model with an uniform density of cosmic rays.
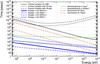 |
Fig. 2 Characteristic times for leptonic loss processes and escape assuming a typical cluster with an age of 1 Myr and a radius of the HII region of RHII = 10 pc. |
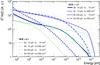 |
Fig. 3 Electron spectra assuming a typical cluster with an age of 1 Myr and with a radius of the HII region of RHII = 10 pc. The electron injection spectrum has a spectral index of s = 2 and an exponential energy cut-off set to Ee,max = 50 TeV. The index of turbulence is set to ν = 3/2 (Iroshnikov-Kraichnan turbulence). |
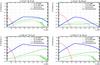 |
Fig. 4 Non-thermal emission for leptonic processes and different magnetic fields and densities assuming a typical cluster with an age of 1 Myr and radius of the HII region of RHII = 10 pc. The spectral index of the injection spectrum is set to s = 2, electron maximum energy is fixed to Ee,max = 50 TeV, turbulence index is ν = 3/2, magnetic turbulence is δB/B = 0.1, and electron-to-proton ratio is set to Kep = 10-2. |
3.1.2. Spectrum
The different electron spectra resulting from a exponentially cut-off power-law injection with an index s = 2 and a electron maximum energy Ee,max = 50 TeV provided to a generic cluster are shown in Fig. 3. Independent of the turbulence index several behaviours can be observed. Firstly, as the density increases, two antagonistic effects occur. On the one hand, the Bremsstrahlung losses increase, which changes the spectrum particularly at high energies; on the other hand, the injection is amplified, thereby increasing the spectrum normalization. Secondly, at high energy, the spectrum drops as a result of synchrotron losses on the magnetic field. The drop occurs even at lower energies and is more marked as the magnetic field gets more intense. Thirdly, the turbulence level has an impact when the synchrotron or Bremsstrahlung losses are significant, i.e. when the density and/or the magnetic field are high. The spectrum is then amplified at all energies.
3.1.3. Non-thermal emission
The photon fluxes are deducted from the electron spectra in the cluster and from the γ-ray emissivity of the different processes, according to Blumenthal & Gould (1970). Figure 4 presents the photon flux in the typical cluster, assuming δB/B = 0.1 for two magnetic field intensities (10 μG and 100 μG) and two densities (10 cm-3 and 1000 cm-3).
As expected, the synchrotron emission dominates the non-thermal emissions below 0.1 GeV whatever the magnetic field and density. Then, Bremsstrahlung emission systematically dominates beyond 1 GeV at high densities. At a low density, Bremsstrahlung emission dominates up to 1 TeV and the IC emission takes over beyond. The IC emission generated from the star light remains generally low; the case here is the most optimistic since it corresponds to the photon flux generated with the light of an O3-type star.
3.2. Protons
3.2.1. Characteristic times
For protons, the dominant loss process is pion production. Adiabatic losses do not play a role as the HII region has an approximate stationary size, and the Coulomb interaction and ionization losses are negligible at the energies under consideration. Figure 5 compares the characteristic times of pion decay to the escape time according to the density, index of turbulence, and magnetic field (intensity and turbulence level).
In most cases, pion production is dominated by escape losses beyond 1 GeV. Pion production and escape losses are comparable in the case of high densities and high turbulence levels. Moreover, as one process clearly dominates the others, the proton spectrum should be monotonous.
3.2.2. Spectrum
The different proton spectra resulting from a power-law injection with an index s = 2 provided to a generic cluster are shown in Fig. 6.
At low densities, the proton spectrum is only slightly sensitive to the index of turbulence and to the magnetic field turbulence level. It follows a power-law distribution with an index that is close to 2.3. At high densities, increasing turbulence level raises the proton spectrum at low energies. The spectrum softens and then reaches an index of 2.45. Slight differences appear between the two indices of turbulence.
Secondary electrons can be deducted from the proton spectra and from the emissivity of the charged pion production, according to Kelner et al. (2006). Their γ-ray emissions are directly compared to those from primary electrons in the next part.
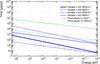 |
Fig. 5 Characteristic times for pion production and escape assuming a typical cluster with an age of 1 Myr and with a radius of the HII region of RHII = 10 pc. |
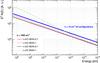 |
Fig. 6 Proton spectra assuming a typical cluster with an age of 1 Myr and radius of the HII region of RHII = 10 pc. The proton injection spectrum has a spectral index of s = 2. The blue line denotes the spectra for all configurations in the low-density scenario. |
3.3. Non-thermal emission from a stellar cluster
3.3.1. Hadronic and leptonic emissions
The simple one-zone model can predict non-thermal emission from both electrons and protons. Figure 7 presents the hadronic and leptonic emission in the typical cluster assuming an electron-to-proton ratio of Kep = 10-2.
These results call for three remarks. Firstly, at high energies, non-thermal emissions are clearly dominated by the pion decay because of the high density in these objects. The leptonic emission can only dominate pion decay emission for a very optimistic Kep ratio greater than 10%. Therefore, the assumption on the magnetic field does not influence the non-thermal emission above 1 GeV. This result is robust considering parameters with their realistic limits (see Sect. 2.5). Secondly, at low energies, the photon flux slightly depends on the intensity and turbulence level of the magnetic field and turbulence index. Thirdly, emissions from secondary electrons are comparable to an injection of primary electron with Kep = 10-2. These emissions remain clearly dominated by π0 decay representing several percent of hadronic emissions above 1 GeV. In conclusion, the young star-forming regions are potentially hadronic sources of γ-rays.
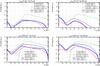 |
Fig. 7 Non-thermal emission from electrons and protons for different magnetic fields and densities assuming a typical cluster with an age of 1 Myr and radius of the HII region of RHII = 10 pc. The spectral index of the injection spectra is set to s = 2, electron maximum energy is fixed to Ee,max = 50 TeV, turbulence index is ν = 3/2, and electron-to-proton ratio is set to Kep = 10-2. |
3.3.2. Temporal evolution
In this model, the luminosity is assumed to be constant over time. The bubble formed by the stellar winds grows with time. Equations (2) and (3) show that the injection rate Q0 is decreasing with time. Particles spectra and non-thermal emissions do not reach a steady state. Figure 8 presents the temporal evolution of the integrated flux from 3 GeV and spectral index Γ of the non-thermal emission, assuming a typical cluster. It can be seen that the integrated flux quickly reaches a maximum and then decreases with time following the injection model (φE> 3 GeV ∝ t− 6/5). This flux is stronger if the density and/or the turbulence level are high. The spectral index quickly stabilizes if the density is high (tstable< 50 kyr). In this case, this depends slightly on the level of turbulence. At low densities, the spectral index typically stabilizes after 106 years and does not change with the turbulence level.
4. Observational constraints
4.1. Sample of stellar clusters
We selected a sample of clusters embedded in HII regions from the Galactic O-Star Catalog1 (GOSC; Maíz Apellániz et al. 2011) version 2.4, containing 1285 O-type stars, following two main criteria:
-
The cluster must correspond to the described model: i) the clusteris young with an age of less than 10 Myr; ii) noevolved star is present in the cluster; iii) No supernova explosionhas occurred in the cluster yet; and iv) the shape of theHII region is almost spherical.
-
The main astrophysical properties of the cluster must be known: i) the population of O-type stars; ii) the radius and density of the HII region; and iii) the distance to the cluster.
The eight clusters corresponding to these criteria are summarized in Table 1.
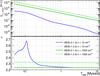 |
Fig. 8 Temporal evolution of the non-thermal emissions (spectral index and integrated flux above 3 GeV) assuming a typical cluster with an age of 1 Myr and with a radius of the HII region of RHII = 10 pc. The spectral index of the injection spectra is set to s = 2, electron maximum energy is fixed to Ee,max = 50 TeV, turbulence index is ν = 3/2, magnetic field strength is B = 10 μG, and electron-to-proton ratio is set to Kep = 10-2. |
4.1.1. Astrophysical properties
The size of the bubble is known in only two clusters: NGC 2244 in the Rosette Nebula and NGC 1976 in the Orion Nebula. The results obtained from these two objects are discussed in detail. These two well-known objects have very different mean densities: 15 cm-3 in the case of the Rosette Nebula and 8900 cm-3 in the case of the Orion Nebula. They are, therefore, ideal to test the model described in this paper.
The star cluster NGC 2244, belonging to the Mon OB2 association, has an age of about 1.9 × 10⁶ years (Park & Sung 2002) and contains six O-type stars. The cluster releases 1037 erg s-1 in stellar winds, creating a giant interstellar bubble (Rb = 6.2 pc) of rarefied matter in the Rosette Nebula. The Rosette Nebula is a HII region of more than 105 solar masses (Williams & McKee 1997), which is ionized by the emission of its embedded star cluster. The nebula is located at a distance of 1.55 kpc (Martins et al. 2012) in the Monoceros constellation and has an apparent size of 1.3°.
The Trapezium cluster (NGC 1976) is located at a distance of 0.41 kpc (Reid et al. 2009) and belongs to the Ori OB1d association. It contains three O-type stars. The mechanical energy released by the cluster of more than 1036 erg s-1 creates a bubble of rarefied matter with a radius of Rb = 2 pc and ionizes the very dense (n = 8900 cm-3) HII region of the Orion Nebula.
Summary of the important astrophysical parameters of the model for each cluster.
The stellar content is not found in the GOSC for two clusters. RCW 8 contains at least two O-type stars, O8.5V and O9.5V (Russeil et al. 1995). The Omega Nebula (NGC 6618) is one of the most luminous HII regions in our Galaxy. It contains 17 O-type stars (Hoffmeister et al. 2008), with a binary O4+04 system CEN 1. A non-thermal radio emission was observed (Rodríguez et al. 2009) and a power-law X-ray emission (Broos et al. 2007) in NGC 6618.
The properties of the other clusters are summarized in the left part of Table 1. Their luminosity is computed from the O-star composition according to Nieuwenhuijzen & de Jager (1990) and Massey & Meyer (2001). The most massive stars clearly dominate the total luminosity of the star clusters. We calculated the total luminosity using Eq. (12) of Weaver et al. (1977) for clusters where the size of the bubble is unknown.
4.2. Fermi data analysis
Gamma-ray emission from the selected clusters is searched for in the data from the Large Area Telescope (LAT) on board the Fermi satellite. The Fermi-LAT is a pair-conversion telescope that is sensitive to photons with energies from 20 MeV to more than 300 GeV (Atwood et al. 2009). The data used in this work were recorded between 2008 August 4 and 2015 June 15 and are reconstructed with the Pass 8 reprocessing chain (Atwood et al. 2013). The analysis is performed using the Fermi ScienceTools v10r0p5 software with the python interface enrico (Sanchez & Deil 2013).
Only events belonging to the source event class and front+back event type are used. All events within a circular region of interest (ROI) of 10° radius centred on the source position are extracted. A zenith angle greater than 90° and time intervals when the rocking angle is larger than 52° were excluded from the analysis to reduce the γ-bright limb of the Earth. Finally, only events with an energy between 3 GeV and 300 GeV are selected.
The unbinned maximum-likelihood method implemented in the gtlike tool is performed to compute the spectral analysis with the P8R2_SOURCE_V6 instrument response functions (IRFs). The star cluster emission is modelled as a diffuse source corresponding to a projected, uniformly filled sphere with a radius RHII and a power-law energy spectrum (powerlaw2).
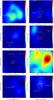 |
Fig. 9 Test statistics (TS) maps of the regions around the star clusters. The red circle denotes the region of interest used in the analysis; white stars (and pink diamonds) represent sources from the 3FGL catalogue with free (fixed) spectral parameters. Contours represent the HII regions (Gaustad et al. 2001). |
The background is modelled using the γ-ray sources of the third Fermi-LAT source catalogue (3FGL; The Fermi-LAT Collaboration 2015) based on four years of observations. Sources of the 3FGL catalogue that coincide with the star clusters are deleted from the background model to account for the case that these objects are part of the emission from the star cluster. The spectral parameters of the sources outside the star cluster but within 3° of the ROI are kept free, and the spectral parameters of the sources further away are fixed to the values from the 3FGL catalogue. The background model also contains contributions from the Galactic diffuse emission (gll_iem_v06) and from the isotropic background (iso_P8R2_SOURCE_V6_v06). In a first step the normalization of the diffuse emissions are kept free in the fit to calculate the best-fit test statistics and to generate sky maps.
In the absence of a signal (test statistics smaller than 25), an upper limit on the integrated γ-ray flux between 3 GeV and 300 GeV is calculated using the Integral method implemented in the Fermi-LAT ScienceTools and assuming a power law with a spectral index of Γ = 2.25 predicted by the one-zone model (3.3). In order to obtain a conservative upper limit, the normalizations of the Galactic diffuse emission model is reduced by 6% of the best-fit values for the calculation of the upper limits.
NGC 2244 – Rosette Nebula
The background model for the Rosette Nebula contains four point-like sources within 3° of NGC 2244 for which the spectral parameters are kept free in the fit. Another18 point-like sources, which are located further away the spectral parameters, are fixed to the values of the 3FGL catalogue. Possible contamination at lower energies from γ-ray emission, produced by the shock from the supernova remnant Monoceros Loop, interacting with the HII region of the Rosette Nebula (Katagiri & Sugiyama 2014) is avoided with the elevated lower energy cut of 3 GeV. The point-like source 3FGL J0634.1+0424 is located within 0.6° of NGC 2244 and is deleted from the background model. This source has a steep and curved spectrum described by a LogParabola model. Therefore, it will not significantly contribute to the γ-ray emission above 3 GeV.
No significant γ-ray-emission from NGC 2244 and the Rosette Nebula is detected in this analysis; the test statistics for this source is TS = 17.5. The first panel of Fig. 9 shows the test statistics map of the surroundings of the Rosette Nebula. The upper limit on the γ-ray flux above 3 GeV at 95% confidence level is Φγ< 5.07 × 10⁻¹⁰ cm-2 s-1.
NGC 1976 – Orion Nebula
The background model of the Orion Nebula contains three point-like sources within 3° with free parameters and another 15 point-like sources further away with fixed spectral parameters. The second panel of Fig. 9 shows the test statistics map of the surroundings of the Orion Nebula. The Orion Nebula itself is not detected with a test statistics of TS = 5.6. The upper limit (95% confidence level) on the γ-ray flux above 3 GeV is Φγ< 3.80 × 10⁻¹⁰ cm-2 s-1.
Others clusters
The analyses of the remaining clusters are conducted in the same way: 3FGL sources coinciding with the star cluster (which are 3FGL J1037.9-5843 in the case of NGC 3324, 3FGL J1139.0-6244 in the case of RCW 62, and 3FGL J0609.2+2051c in the case of NGC 2175) are deleted from the background model, the spectral parameters of sources within 3° are kept free in the fit and the spectral parameters of sources further away are fixed to the 3FGL values.
No significant emission from any of these clusters is detected. The test statistics maps of all clusters are shown in Fig. 9. The test statistics of the clusters and the corresponding upper limits on the γ-ray flux are summarized in Table 1.
5. Data-model comparison
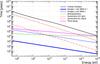 |
Fig. 10 Characteristic times for escape; leptonic and hadronic loss processes in the Rosette Nebula (age = 1.9 My, RHII = 16.9 pc, nHII = 15 cm-3). |
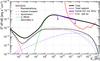 |
Fig. 11 Fermi-LAT upper limits and theoretical expectations on the spectral energy density deduced from models of the Rosette Nebula for realistic parameters: the turbulence index is ν = 3/2, magnetic turbulence is δB/B = 0.1, and electron-to-proton ratio is set to Kep = 10-2. The magnetic field is 10 μG. The red dashed line represents the sensitivity of CTA (5σ detection in 50 h, Becherini et al. 2012). |
The non-detection of γ-ray emission with Fermi-LAT and the upper limits on the integrated γ-ray flux can be used to put constraints on the particle acceleration in the cluster. The goal is to determine the fraction ξ of the stellar wind luminosity converted into accelerated particles in each cluster.
In the one-zone model discussed here γ-ray emission is produced by cluster-accelerated, relativistic particles interacting with the dense material in the surrounding HII region. As shown in Sect. 3, the γ-ray emission is clearly dominated by pion decay from the HII region. Thus, the density nHII of the HII region is the crucial parameter. The second important parameter is the magnetic field that impacts both protons and electrons through diffusion and electrons through synchrotron radiation. As shown by Harvey-Smith et al. (2011), however, the magnetic field in the HII region directly depends on the matter density nHII . Therefore, the two well-studied clusters, NGC 2244 and NGC 1976, which have very different densities nHII , are ideal candidates to study particle acceleration and γ-ray emission of stellar clusters in detail.
5.1. NGC 2244 – Rosette Nebula
With a density of nHII = 15 cm-3, in the HII region NGC 2244 and the Rosette Nebula can be considered as a prime example for a low-density scenario.
Figure 10 shows the characteristic times for the different energy loss processes for the Rosette Nebula. Above 1 GeV the escape timescale in the case of low magnetic field perturbations (solid blue line) is shorter than any other process. Only synchrotron emission in a strong magnetic field (dot-dashed red line), which is unlikely owing to the low density in the Rosette Nebula, dominates the escape time at higher energies in the case of high magnetic perturbations (dashed blue line). As pion decay is the most dominant process after escape, the impact of synchrotron losses on the γ-ray emission can be neglected.
The spectral energy distribution of the predicted emission for a specific set of parameters (Kep = 10-2, δB/B = 0.1, B = 10 μG, ν = 3/2) is shown in Fig. 11. The upper limit on the γ-ray flux constrains the ratio of the stellar wind luminosity that is converted into accelerated particles, in this particular case, to ξ< 5.5%. Exploring the possible set of the parameters Kep, δB/B and ν according to 2.5 demonstrates that not more than a fraction ξmax = 5.8% of the stellar wind luminosity of NGC 2244 can be converted into relativistic particles.
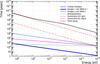 |
Fig. 12 Characteristic times for escape, leptonic, and hadronic loss processes in the Orion Nebula (age = 2.5 My, RHII = 3.7 pc, nHII = 8900 cm-3). |
5.2. NGC 1976 – Orion Nebula
With a density of nHII = 8900 cm-3, NGC 1976 can be considered as a prime example for a high-density scenario.
Figure 12 shows the characteristic times for the Orion Nebula. Contrary to the Rosette Nebula, Bremsstrahlung (green line) and pion production (dashed magenta line) become dominant. They even dominate the escape timescale at high turbulence levels (dashed blue line).
The spectral energy distribution of the γ-ray emission for the parameters Kep = 10-2, δB/B = 0.1, B = 100μG and ν = 3/2 is shown in Fig. 13. The upper limit on the γ-ray emission restricts the conversion ratio of stellar wind luminosity to accelerated particles, in this case, to ξ< 6.3%. Exploring the possible parameter space (according to 2.5 part) demonstrates that not more than ξmax = 6.7 % of the stellar wind luminosity of NGC 1976 can be converted into relativistic particles.
5.3. Sample of embedded star clusters
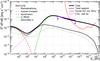 |
Fig. 13 Fermi-LAT upper limits and theoretical expectations on the spectral energy density deduced from models of the Orion Nebula for realistic parameters: the turbulence index is ν = 3/2, magnetic turbulence is δB/B = 0.1, and electron-to-proton ratio is set to Kep = 10-2. The magnetic field is 100 μG. The red dashed line represents the sensitivity of CTA (5σ detection in 50 h; Becherini et al. 2012). |
The maximum fractions of conversion of stellar luminosity into relativistic particles for all the clusters are summarized in Table 1. The conversion fraction ξmax for clusters NGC 2175 and NGC 2467 are around 10%, which is similar to the Rosette and Orion Nebulae discussed above.
The clusters RCW 62 and NGC 6618 set very low limits on ξmax of less than 1%. With similar luminosities and distances as NGC 2244, the much higher densities in the HII regions allow us to probe much lower levels of relativistic protons in the cluster.
The upper limits on the γ-ray flux obtained on NGC 3324 and RCW 8 do not allow us to reach any conclusion on the luminosity conversion into relativistic particles. This is because of the low stellar wind luminosity (created by only two O-type stars of relatively low mass), large distance (as they are the most and third-most distant objects in the sample), and relatively low density nHII in the HII region.
6. Discussion
6.1. Influence of the main parameters
So far, we tested the maximum conversion fraction of stellar wind luminosity into relativistic particles for a magnetic turbulence level of δB/B = 0.1, coherence length of lc = 1 pc, and spectral index of the injection spectrum of s = 2 (see Sect. 2.5 for details on these parameters). Now the influence of these parameters on the maximum conversion fraction ξmax is tested for the star clusters NGC 2244 and NGC 1976 to verify the reliability of the presented results. The impact of these parameters on the maximum conversion fraction is summarized in Table 2.
Influence of the main parameters (magnetic turbulence level δB/B, coherence length lc, index of injection s with Emax = 10 PeV) on the upper limit of the fraction of mechanical energy converted into accelerated particles ξmax for NGC 2244 (Rosette Nebula) and NGC 1976 (Orion Nebula).
With a decreasing magnetic turbulence level δB/B or increasing coherence length lc diffusion losses become more important. Therefore, the expected γ-ray flux is lower. In turn, the maximum conversion efficiency ξmax is higher. This trend is even more important for the high-density scenario, such as in NGC 1976. However, the obtained ξmax are lower than 10%. The results presented here are robust in the change of the parameters δB/B and lc.
The influence of the spectral index s of the injection spectrum is more important. A change of the injection index changes the spectral index Γ of the γ-ray emission. For spectral indices of s = 1.5 and s = 2.5, the spectral index of the γ-ray emission is Γ = 1.7 and Γ = 2.7, respectively. We repeated the analysis of the Fermi-LAT data to obtain upper limits on the γ-ray flux for these indices. With increasing spectral index, the predicted flux at low energies increases and hence the conversion efficiency ξmax decreases to remain compatible with the upper limit on the γ-ray emission. For an injection index of s = 2.5 the maximum conversion fraction is below 1%.
For an injection index s below 2, the maximum energy Emax becomes important in the calculation of the injection rate Q0 (see Eq. (3)). For instance, for an injection index of s = 1.5 the relation is  . As the maximum conversion factor ξmax depends linearly on the injection rate, it also significantly rises. For Emax = 10 PeV, ξmax is about 16% for the Rosette Nebula and 23% for Orion Nebula. However, such indices require very specific origins; they could for instance be produced by collective shock acceleration (Klepach et al. 2000; Bykov 2001).
6.2. Sensitivity of CTA to the selected star clusters
Figures 11 and 12 show that the predicted γ-ray emission extends up to energies of several tens of TeV, which is an energy range accessible to CTA (Actis et al. 2011; Acharya et al. 2013).
With the one-zone model presented here and assuming realistic parameters, the minimum conversion efficiency ξCTA allowing a detection with CTA can be estimated. If the conversion efficiency for a star cluster is larger than ξCTA it will be detected with a statistical significance of more than 5σ after 50 h of observations (using the sensitivity curves of Becherini et al. 2012). These minimum efficiencies for the selected set of star clusters are summarized in Table 3.
A detection is possible with a conversion efficiency as low as 1% for most of the clusters. NGC 2244 and NGC 1976, in particular, are still ideal targets for CTA because many of the input parameters for the modelling are constricted by existing observations. In the case of non-detection, the limits on the conversion efficiency could be significantly improved.
Minimal efficiencies for a 5σ detection after 50 h observation time with the future Cherenkov Telescope Array (CTA; Becherini et al. 2012) assuming realistic parameters (see Sect. 2.5).
7. Conclusions
The γ-ray emission from young stellar clusters embedded in molecular clouds is modelled with a one-zone model, where the stellar wind luminosity is converted into relativistic protons and electrons that subsequently produce electro-magnetic radiation through synchrotron radiation, inverse Compton upscattering of low-energy photon fields, and decay of pions produced in hadronic interactions. The predictions are then compared with Fermit-LAT data and with the CTA sensitivity. The main conclusions obtained are: i) Pion decay is clearly the dominating process for γ-ray production. ii) We selected eight embedded stellar clusters based on their astrophysical properties corresponding to the presented one-zone model. No significant γ-ray emission from these star clusters was found with the Fermi-LAT in the energy range from 3 to 300 GeV. iii) The upper limits on the γ-ray emission from these clusters show that not more than about 10% of the stellar wind luminosity is converted into relativistic particles. Certain clusters must have an even lower acceleration efficiency of less then 1%. These results are reliable considering realistic parameters in the modelling. Only injection spectra harder than s = 2 could provide acceleration efficiency higher than 10%. However, the results presented here only consider young stellar clusters. It cannot be excluded that the stellar wind luminosity is converted much more efficiently in older stellar clusters containing more evolved stars or supernova remnants. iv) The CTA would be able to detect γ-ray emission from the clusters NGC 2244, NGC 1976, NGC 2467, or NGC 2175 in the case of an acceleration efficiency of close to one percent.
References
- Abdo, A. A., Ackermann, M., Ajello, M., et al. 2010, ApJ, 723, 649 [NASA ADS] [CrossRef] [Google Scholar]
- Abramowski, A., Acero, F., Aharonian, F., et al. 2012, A&A, 537, A114 [NASA ADS] [CrossRef] [EDP Sciences] [Google Scholar]
- Abramowski, A., Aharonian, F., Ait Benkhali, F., et al. 2015, Science, 347, 406 [NASA ADS] [CrossRef] [Google Scholar]
- Acharya, B. S., Actis, M., Aghajani, T., et al. 2013, Astrop. Phys., 43, 3 [Google Scholar]
- Ackermann, M., Ajello, M., Allafort, A., et al. 2011, Science, 334, 1103 [NASA ADS] [CrossRef] [PubMed] [Google Scholar]
- Actis, M., Agnetta, G., Aharonian, F., et al. 2011, Exper. Astron., 32, 193 [Google Scholar]
- Aharonian, F., & Atoyan, A. 2000, A&A, 362, 937 [NASA ADS] [Google Scholar]
- Atwood, W. B., Abdo, A. A., Ackermann, M., et al. 2009, ApJ, 697, 1071 [NASA ADS] [CrossRef] [Google Scholar]
- Atwood, W., Albert, A., Baldini, L., et al. 2013, 2012 Fermi Symp. Proc. – eConf C121028 [Google Scholar]
- Becherini, Y., Khélifi, B., Pita, S., Punch, M., & CTA Consortium. 2012, in AIP Conf. Ser. 1505, eds. F. A. Aharonian, W. Hofmann, & F. M. Rieger, 769 [Google Scholar]
- Bednarek, W. 2007, MNRAS, 382, 367 [NASA ADS] [CrossRef] [Google Scholar]
- Bell, A. R., & Lucek, S. G. 2001, MNRAS, 321, 433 [NASA ADS] [CrossRef] [Google Scholar]
- Blumenthal, G. R., & Gould, R. J. 1970, Rev. Mod. Phys., 42, 237 [NASA ADS] [CrossRef] [Google Scholar]
- Broos, P. S., Feigelson, E. D., Townsley, L. K., et al. 2007, ApJS, 169, 353 [NASA ADS] [CrossRef] [Google Scholar]
- Butt, Y. M. 2010, ApJ, 725, 1 [NASA ADS] [CrossRef] [Google Scholar]
- Bykov, A. M. 2001, Space Sci. Rev., 99, 317 [Google Scholar]
- Bykov, A. M., Gladilin, P. E., & Osipov, S. M. 2013, MNRAS, 429, 2755 [Google Scholar]
- Domingo-Santamaría, E., & Torres, D. F. 2006, A&A, 448, 613 [NASA ADS] [CrossRef] [EDP Sciences] [Google Scholar]
- Drury, L. O., Ellison, D. E., Aharonian, F. A., et al. 2001, Space Sci. Rev., 99, 329 [NASA ADS] [CrossRef] [Google Scholar]
- Ferrand, G., & Marcowith, A. 2010, A&A, 510, A101 [NASA ADS] [CrossRef] [EDP Sciences] [Google Scholar]
- Ferrand, G., Downes, T., & Marcowith, A. 2008, MNRAS, 383, 41 [NASA ADS] [Google Scholar]
- Freyer, T., Hensler, G., & Yorke, H. W. 2003, ApJ, 594, 888 [NASA ADS] [CrossRef] [Google Scholar]
- Gaustad, J. E., McCullough, P. R., Rosing, W., & Van Buren, D. 2001, PASP, 113, 1326 [NASA ADS] [CrossRef] [Google Scholar]
- Giacinti, G., Kachelrieß, M., & Semikoz, D. V. 2014, Phys. Rev. D, 90, 041302 [NASA ADS] [CrossRef] [Google Scholar]
- Harvey-Smith, L., Madsen, G. J., & Gaensler, B. M. 2011, ApJ, 736, 83 [NASA ADS] [CrossRef] [Google Scholar]
- Hoffmeister, V. H., Chini, R., Scheyda, C. M., et al. 2008, ApJ, 686, 310 [NASA ADS] [CrossRef] [Google Scholar]
- Katagiri, H., & Sugiyama, S. 2014, in 40th COSPAR Scientific Assembly, COSPAR Meeting, 40, 1419 [Google Scholar]
- Kelner, S. R., Aharonian, F. A., & Bugayov, V. V. 2006, Phys. Rev. D, 74, 034018 [NASA ADS] [CrossRef] [Google Scholar]
- Klepach, E. G., Ptuskin, V. S., & Zirakashvili, V. N. 2000, Astropar. Phys., 13, 161 [Google Scholar]
- Komin, N. et al. 2011, in Particle Physics and Cosmology, eds. L. Celnikier, J. Dumarchez, B. Klima, & J. Tran Than Van, ArXiv e-prints [arXiv:1201.0641] [Google Scholar]
- Maíz Apellániz, J., Sota, A., & Walborn, N. R., et al. 2011, Highlights of Spanish Astrophysics VI, 467 [Google Scholar]
- Marcowith, A., & Casse, F. 2010, A&A, 515, A90 [NASA ADS] [CrossRef] [EDP Sciences] [Google Scholar]
- Martins, F., Mahy, L., Hillier, D. J., & Rauw, G. 2012, A&A, 538, A39 [NASA ADS] [CrossRef] [EDP Sciences] [Google Scholar]
- Massey, P., & Meyer, M. 2001, Encyclopedia of Astronomy and Astrophysics (Bristol: Institute of Physics Publishing) [Google Scholar]
- Nieuwenhuijzen, H., & de Jager, C. 1990, A&A, 231, 134 [NASA ADS] [Google Scholar]
- Parizot, E., Marcowith, A., van der Swaluw, E., Bykov, A., & Tatischeff, V. 2004, A&A, 424, 747 [NASA ADS] [CrossRef] [EDP Sciences] [Google Scholar]
- Parizot, E., Marcowith, A., Ballet, J., & Gallant, Y. A. 2006, A&A, 453, 387 [NASA ADS] [CrossRef] [EDP Sciences] [Google Scholar]
- Park, B.-G., & Sung, H. 2002, AJ, 123, 892 [NASA ADS] [CrossRef] [Google Scholar]
- Ptuskin, V. S., Moskalenko, I. V., Jones, F. C., Strong, A. W., & Zirakashvili, V. N. 2006, ApJ, 642, 902 [NASA ADS] [CrossRef] [Google Scholar]
- Reid, M. J., Menten, K. M., Zheng, X. W., et al. 2009, ApJ, 700, 137 [NASA ADS] [CrossRef] [Google Scholar]
- Reitberger, K., Reimer, A., Reimer, O., & Takahashi, H. 2015, A&A, 577, A100 [NASA ADS] [CrossRef] [EDP Sciences] [Google Scholar]
- Rodríguez, L. F., González, R. F., & Montes, G. 2009, Rev. Mex. Astron. Astrofis., 45, 273 [NASA ADS] [Google Scholar]
- Russeil, D., Georgelin, Y. M., Georgelin, Y. P., Le Coarer, E., & Marcelin, M. 1995, A&AS, 114, 557 [NASA ADS] [Google Scholar]
- Sanchez, D. A., & Deil, C. 2013, ArXiv e-prints [arXiv:1307.4534] [Google Scholar]
- The Fermi-LAT Collaboration. 2015, ApJS, 218, 23 [Google Scholar]
- Torres, D. F., Domingo-Santamaría, E., & Romero, G. E. 2004, ApJ, 601, L75 [NASA ADS] [CrossRef] [Google Scholar]
- Voelk, H. J., & Forman, M. 1982, ApJ, 253, 188 [NASA ADS] [CrossRef] [Google Scholar]
- Weaver, R., McCray, R., Castor, J., Shapiro, P., & Moore, R. 1977, ApJ, 218, 377 [NASA ADS] [CrossRef] [Google Scholar]
- Williams, J. P., & McKee, C. F. 1997, ApJ, 476, 166 [NASA ADS] [CrossRef] [Google Scholar]
All Tables
Influence of the main parameters (magnetic turbulence level δB/B, coherence length lc, index of injection s with Emax = 10 PeV) on the upper limit of the fraction of mechanical energy converted into accelerated particles ξmax for NGC 2244 (Rosette Nebula) and NGC 1976 (Orion Nebula).
Minimal efficiencies for a 5σ detection after 50 h observation time with the future Cherenkov Telescope Array (CTA; Becherini et al. 2012) assuming realistic parameters (see Sect. 2.5).
All Figures
|
Fig. 1 Spherical model of a star cluster embedded in a HII region. The interstellar bubble (or region 1) has a radius Rb. The HII region (or region 2) has an outer radius of RHII and is characterized by the density n, magnetic field strength B, intensity of the magnetic turbulence level δB, and index of turbulence ν. The interstellar bubble is much smaller than the HII region, Rb ≪ RHII. |
| In the text | |
|
Fig. 2 Characteristic times for leptonic loss processes and escape assuming a typical cluster with an age of 1 Myr and a radius of the HII region of RHII = 10 pc. |
| In the text | |
|
Fig. 3 Electron spectra assuming a typical cluster with an age of 1 Myr and with a radius of the HII region of RHII = 10 pc. The electron injection spectrum has a spectral index of s = 2 and an exponential energy cut-off set to Ee,max = 50 TeV. The index of turbulence is set to ν = 3/2 (Iroshnikov-Kraichnan turbulence). |
| In the text | |
|
Fig. 4 Non-thermal emission for leptonic processes and different magnetic fields and densities assuming a typical cluster with an age of 1 Myr and radius of the HII region of RHII = 10 pc. The spectral index of the injection spectrum is set to s = 2, electron maximum energy is fixed to Ee,max = 50 TeV, turbulence index is ν = 3/2, magnetic turbulence is δB/B = 0.1, and electron-to-proton ratio is set to Kep = 10-2. |
| In the text | |
|
Fig. 5 Characteristic times for pion production and escape assuming a typical cluster with an age of 1 Myr and with a radius of the HII region of RHII = 10 pc. |
| In the text | |
|
Fig. 6 Proton spectra assuming a typical cluster with an age of 1 Myr and radius of the HII region of RHII = 10 pc. The proton injection spectrum has a spectral index of s = 2. The blue line denotes the spectra for all configurations in the low-density scenario. |
| In the text | |
|
Fig. 7 Non-thermal emission from electrons and protons for different magnetic fields and densities assuming a typical cluster with an age of 1 Myr and radius of the HII region of RHII = 10 pc. The spectral index of the injection spectra is set to s = 2, electron maximum energy is fixed to Ee,max = 50 TeV, turbulence index is ν = 3/2, and electron-to-proton ratio is set to Kep = 10-2. |
| In the text | |
|
Fig. 8 Temporal evolution of the non-thermal emissions (spectral index and integrated flux above 3 GeV) assuming a typical cluster with an age of 1 Myr and with a radius of the HII region of RHII = 10 pc. The spectral index of the injection spectra is set to s = 2, electron maximum energy is fixed to Ee,max = 50 TeV, turbulence index is ν = 3/2, magnetic field strength is B = 10 μG, and electron-to-proton ratio is set to Kep = 10-2. |
| In the text | |
|
Fig. 9 Test statistics (TS) maps of the regions around the star clusters. The red circle denotes the region of interest used in the analysis; white stars (and pink diamonds) represent sources from the 3FGL catalogue with free (fixed) spectral parameters. Contours represent the HII regions (Gaustad et al. 2001). |
| In the text | |
|
Fig. 10 Characteristic times for escape; leptonic and hadronic loss processes in the Rosette Nebula (age = 1.9 My, RHII = 16.9 pc, nHII = 15 cm-3). |
| In the text | |
|
Fig. 11 Fermi-LAT upper limits and theoretical expectations on the spectral energy density deduced from models of the Rosette Nebula for realistic parameters: the turbulence index is ν = 3/2, magnetic turbulence is δB/B = 0.1, and electron-to-proton ratio is set to Kep = 10-2. The magnetic field is 10 μG. The red dashed line represents the sensitivity of CTA (5σ detection in 50 h, Becherini et al. 2012). |
| In the text | |
|
Fig. 12 Characteristic times for escape, leptonic, and hadronic loss processes in the Orion Nebula (age = 2.5 My, RHII = 3.7 pc, nHII = 8900 cm-3). |
| In the text | |
|
Fig. 13 Fermi-LAT upper limits and theoretical expectations on the spectral energy density deduced from models of the Orion Nebula for realistic parameters: the turbulence index is ν = 3/2, magnetic turbulence is δB/B = 0.1, and electron-to-proton ratio is set to Kep = 10-2. The magnetic field is 100 μG. The red dashed line represents the sensitivity of CTA (5σ detection in 50 h; Becherini et al. 2012). |
| In the text | |
Current usage metrics show cumulative count of Article Views (full-text article views including HTML views, PDF and ePub downloads, according to the available data) and Abstracts Views on Vision4Press platform.
Data correspond to usage on the plateform after 2015. The current usage metrics is available 48-96 hours after online publication and is updated daily on week days.
Initial download of the metrics may take a while.