Free Access
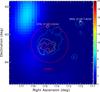
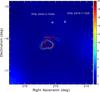
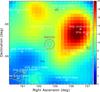
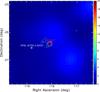
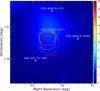
Fig. 9
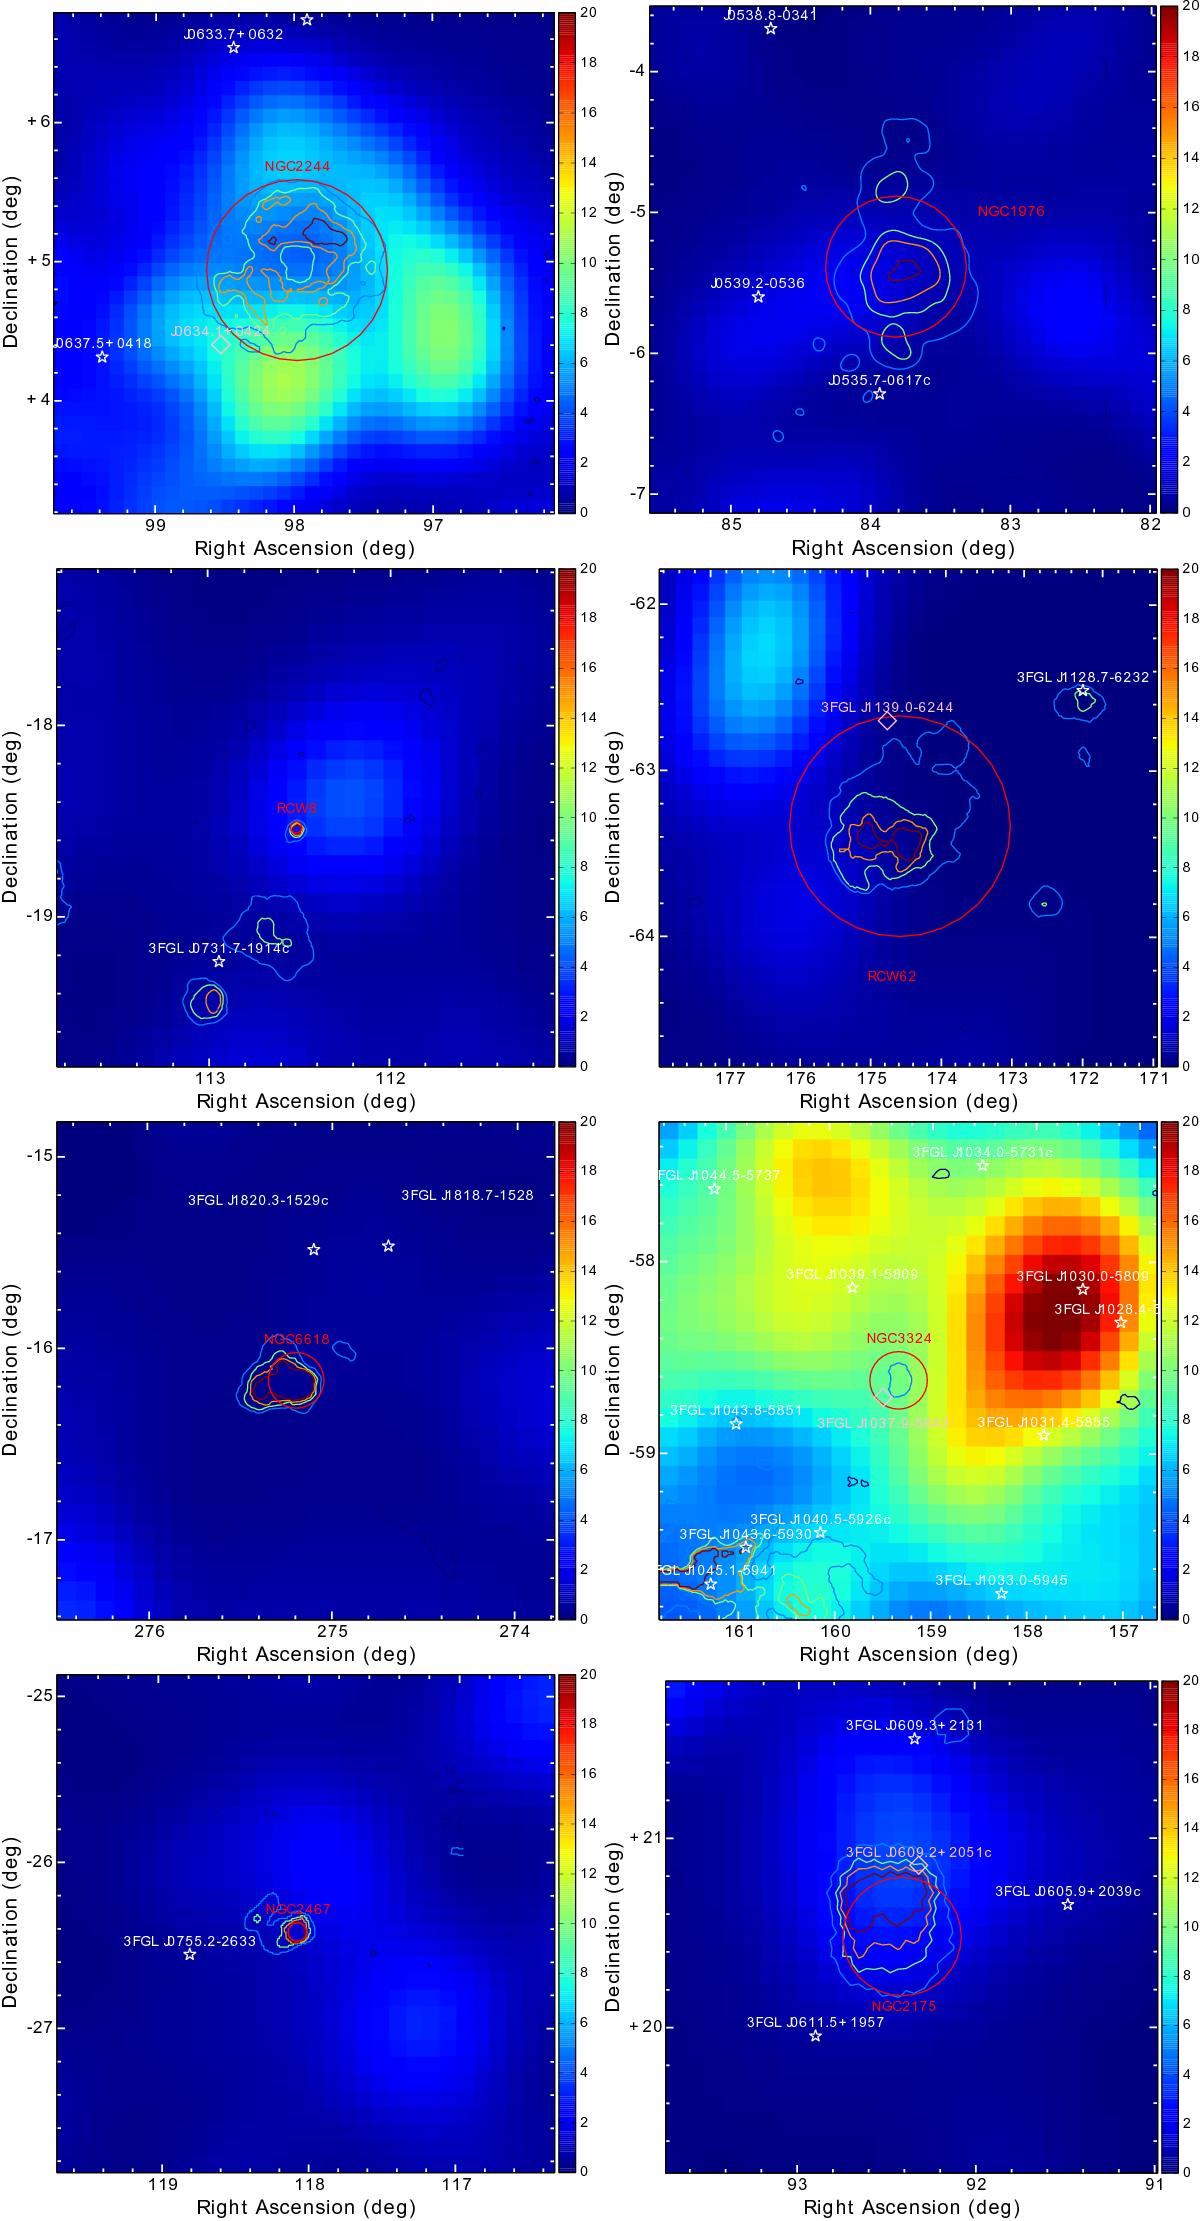
Test statistics (TS) maps of the regions around the star clusters. The red circle denotes the region of interest used in the analysis; white stars (and pink diamonds) represent sources from the 3FGL catalogue with free (fixed) spectral parameters. Contours represent the HII regions (Gaustad et al. 2001).
This figure is made of several images, please see below:
Current usage metrics show cumulative count of Article Views (full-text article views including HTML views, PDF and ePub downloads, according to the available data) and Abstracts Views on Vision4Press platform.
Data correspond to usage on the plateform after 2015. The current usage metrics is available 48-96 hours after online publication and is updated daily on week days.
Initial download of the metrics may take a while.