Fig. 9
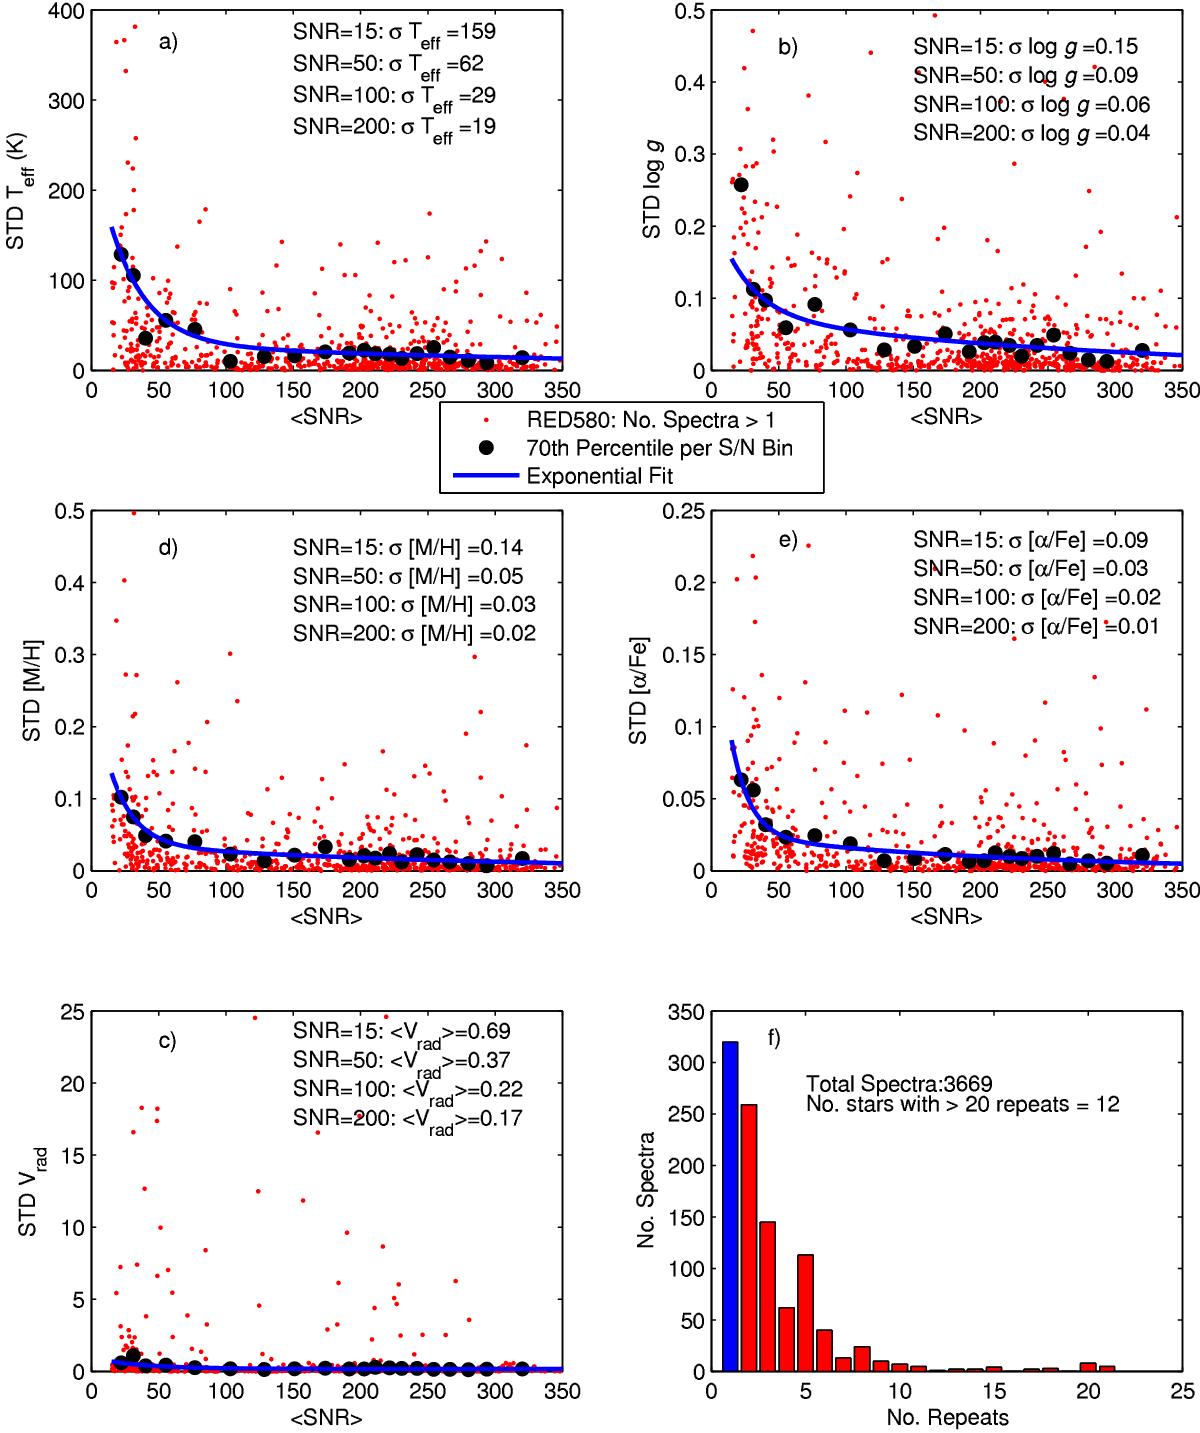
Analysis of repeated measurements for RED580 showing the standard deviation of parameters with S/N for a) Teff; b) log g; c) Vrad; d) [M/H] and e) [α/Fe]. The histogram of number of spectra per number of repeats is shown in f). Individual stars are shown as red dots. The 70th percentile of the S/N bins are shown as black dots. The exponential fit to the black dots are shown as a blue line.
Current usage metrics show cumulative count of Article Views (full-text article views including HTML views, PDF and ePub downloads, according to the available data) and Abstracts Views on Vision4Press platform.
Data correspond to usage on the plateform after 2015. The current usage metrics is available 48-96 hours after online publication and is updated daily on week days.
Initial download of the metrics may take a while.